
Landlord's Agent in 2016
Chris Howard
(508) 801-7485
1 in this area
48 Total Sales
Estimated Value: $430,000 - $467,000
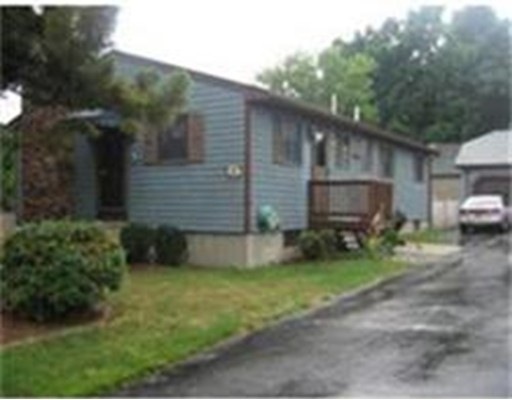
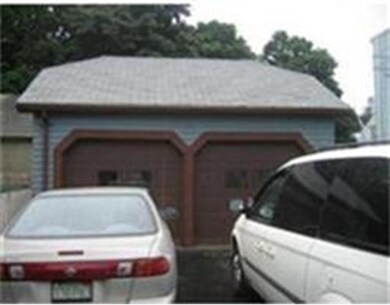
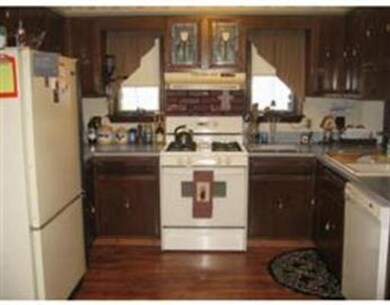
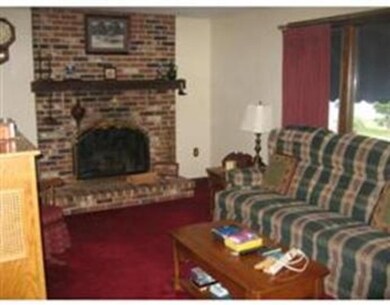
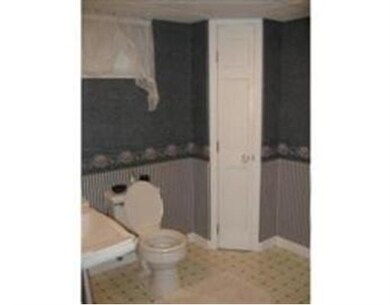
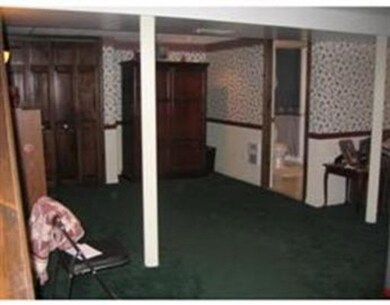
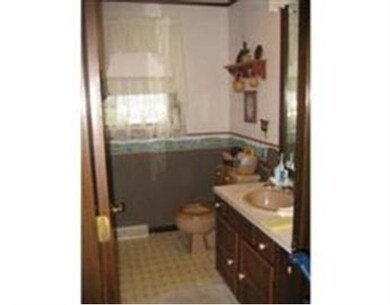
Immaculate home w/ 2 bdrms, 2 full baths, and central air. Ideal location- minutes away from highway. dining room, spacious living room . Partially finished basement for entertaining or for a 3rd bdrm w/ full bath. 2 car garage w/ lots of storage no pets please don't ask ,if it is a therapy pet we will require full docs and doctors disclosure .and length of time of ownership and length of time that pet has been certified as a therapy pet. otherwise please don't ask if they will accept a pet.!!! tenants will be responsible for all snow and ice removal and lawn care. No showings till after June 12th, 2016 . please see attached application and credit check must filled out prior to showing
Home Type
Other
Est. Annual Taxes
$4,888
Year Built
1976
Lot Details
0
| Date | Buyer | Sale Price | Title Company |
|---|---|---|---|
| Crossman Ray N | $443,000 | None Available | |
| Crossman Ray N | $443,000 | None Available | |
| Crossman Ray N | $443,000 | None Available | |
| Cooley Tracy L | -- | None Available | |
| Cooley Tracy L | -- | None Available | |
| Mendonca Betty J | $254,000 | -- | |
| Mendonca Betty J | $254,000 | -- | |
| Motta Cynthia M | -- | -- | |
| Motta Cynthia M | -- | -- | |
| Mendonca Betty J | $254,000 | -- | |
| Motta Cynthia M | -- | -- |
| Date | Status | Borrower | Loan Amount |
|---|---|---|---|
| Open | Crossman Ray N | $252,255 | |
| Closed | Crossman Ray N | $252,255 | |
| Previous Owner | Cooley Tracy L | $220,661 | |
| Previous Owner | Mendonca Betty J | $203,200 | |
| Previous Owner | Motta Cynthia M | $88,000 |
| Date | Event | Price | List to Sale | Price per Sq Ft |
|---|---|---|---|---|
| 08/01/2016 08/01/16 | Rented | $1,450 | 0.0% | -- |
| 06/30/2016 06/30/16 | Under Contract | -- | -- | -- |
| 06/06/2016 06/06/16 | For Rent | $1,450 | +11.5% | -- |
| 05/05/2014 05/05/14 | Rented | $1,300 | -7.1% | -- |
| 05/05/2014 05/05/14 | For Rent | $1,400 | -- | -- |
| Year | Tax Paid | Tax Assessment Tax Assessment Total Assessment is a certain percentage of the fair market value that is determined by local assessors to be the total taxable value of land and additions on the property. | Land | Improvement |
|---|---|---|---|---|
| 2025 | $4,888 | $367,500 | $168,100 | $199,400 |
| 2024 | $4,578 | $357,900 | $168,100 | $189,800 |
| 2023 | $3,935 | $310,300 | $139,900 | $170,400 |
| 2022 | $3,628 | $273,000 | $120,300 | $152,700 |
| 2021 | $3,652 | $248,800 | $108,500 | $140,300 |
| 2020 | $3,663 | $240,700 | $108,200 | $132,500 |
| 2019 | $4,176 | $228,800 | $108,200 | $120,600 |
| 2018 | $3,157 | $211,400 | $100,400 | $111,000 |
| 2017 | $3,492 | $200,700 | $95,300 | $105,400 |
| 2016 | $3,514 | $200,700 | $95,300 | $105,400 |
| 2015 | $3,569 | $205,700 | $100,800 | $104,900 |
| 2014 | $4,960 | $205,400 | $97,900 | $107,500 |
Landlord's Agent in 2016
Chris Howard
(508) 801-7485
1 in this area
48 Total Sales
Source: MLS Property Information Network (MLS PIN)
MLS Number: 72017819
APN: SOME-000001B-000000-000007
Disclaimer: Certain information contained herein is derived from information provided by parties other than Homes.com. All information provided is deemed reliable, but is not guaranteed to be accurate and should be independently verified.
![]() The property listing data and information, or the Images, set forth herein were provided to MLS Property Information Network, Inc. from third party sources, including sellers, lessors and public records, and were compiled by MLS Property Information Network, Inc. The property listing data and information, and the Images, are for the personal, non-commercial use of consumers having a good faith interest in purchasing or leasing listed properties of the type displayed to them and may not be used for any purpose other than to identify prospective properties which such consumers may have a good faith interest in purchasing or leasing. MLS Property Information Network, Inc. and its subscribers disclaim any and all representations and warranties as to the accuracy of the property listing data and information, or as to the accuracy of any of the Images, set forth herein.
The property listing data and information, or the Images, set forth herein were provided to MLS Property Information Network, Inc. from third party sources, including sellers, lessors and public records, and were compiled by MLS Property Information Network, Inc. The property listing data and information, and the Images, are for the personal, non-commercial use of consumers having a good faith interest in purchasing or leasing listed properties of the type displayed to them and may not be used for any purpose other than to identify prospective properties which such consumers may have a good faith interest in purchasing or leasing. MLS Property Information Network, Inc. and its subscribers disclaim any and all representations and warranties as to the accuracy of the property listing data and information, or as to the accuracy of any of the Images, set forth herein.