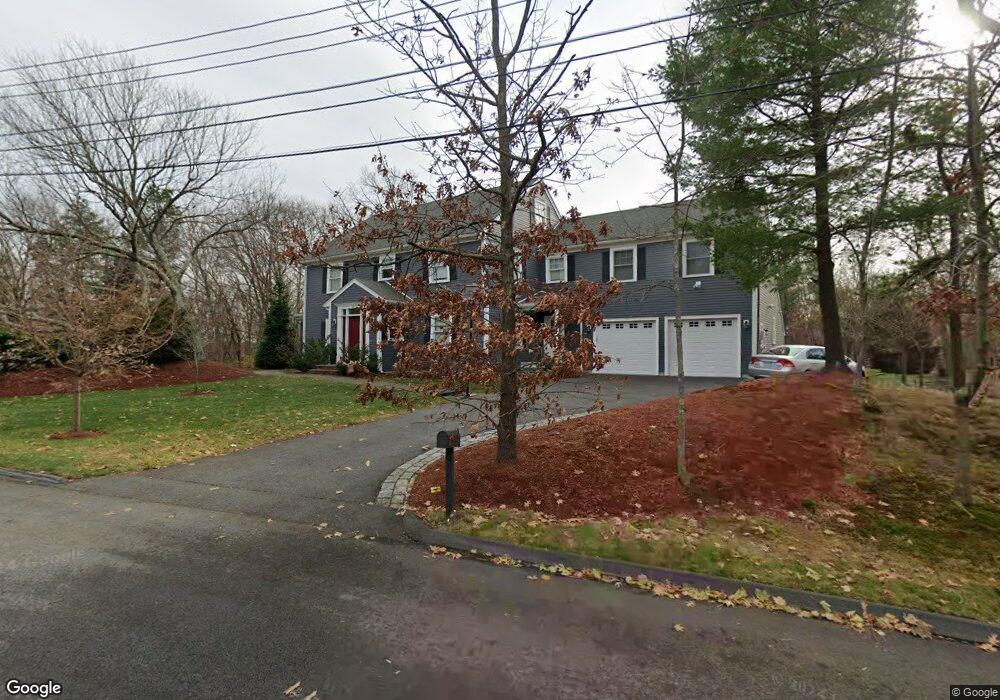
33 Whipple Rd Lexington, MA 02420
Countryside NeighborhoodEstimated Value: $2,679,000 - $3,120,000
5
Beds
6
Baths
4,029
Sq Ft
$716/Sq Ft
Est. Value
About This Home
This home is located at 33 Whipple Rd, Lexington, MA 02420 and is currently estimated at $2,883,559, approximately $715 per square foot. 33 Whipple Rd is a home located in Middlesex County with nearby schools including Harrington Elementary School, Jonas Clarke Middle School, and Lexington High School.
Ownership History
Date
Name
Owned For
Owner Type
Purchase Details
Closed on
Nov 26, 2019
Sold by
Rao Sandhya D and Hiltunen Erik S
Bought by
33 Whipple Rd & Lot 186B Nt
Current Estimated Value
Purchase Details
Closed on
Nov 26, 2013
Sold by
Rao Devulapalli V and Rao Lalitha D
Bought by
Hiltunen Erik S and Rao Sandhya D
Home Financials for this Owner
Home Financials are based on the most recent Mortgage that was taken out on this home.
Original Mortgage
$250,000
Interest Rate
4.25%
Mortgage Type
New Conventional
Purchase Details
Closed on
Mar 17, 2008
Sold by
Rao Rt and Rao
Bought by
Rao Devulapalli V and Rao Lalitha D
Create a Home Valuation Report for This Property
The Home Valuation Report is an in-depth analysis detailing your home's value as well as a comparison with similar homes in the area
Home Values in the Area
Average Home Value in this Area
Purchase History
| Date | Buyer | Sale Price | Title Company |
|---|---|---|---|
| 33 Whipple Rd & Lot 186B Nt | -- | None Available | |
| 33 Whipple Rd & Lot 186B Nt | -- | None Available | |
| Hiltunen Erik S | $590,000 | -- | |
| Hiltunen Erik S | $590,000 | -- | |
| Rao Devulapalli V | -- | -- | |
| Rao Devulapalli V | -- | -- |
Source: Public Records
Mortgage History
| Date | Status | Borrower | Loan Amount |
|---|---|---|---|
| Previous Owner | Hiltunen Erik S | $250,000 |
Source: Public Records
Tax History Compared to Growth
Tax History
| Year | Tax Paid | Tax Assessment Tax Assessment Total Assessment is a certain percentage of the fair market value that is determined by local assessors to be the total taxable value of land and additions on the property. | Land | Improvement |
|---|---|---|---|---|
| 2025 | $29,535 | $2,415,000 | $963,000 | $1,452,000 |
| 2024 | $28,604 | $2,335,000 | $917,000 | $1,418,000 |
| 2023 | $26,702 | $2,054,000 | $834,000 | $1,220,000 |
| 2022 | $25,972 | $1,882,000 | $759,000 | $1,123,000 |
| 2021 | $26,881 | $1,868,000 | $753,000 | $1,115,000 |
| 2020 | $25,051 | $1,783,000 | $753,000 | $1,030,000 |
| 2019 | $24,456 | $1,732,000 | $717,000 | $1,015,000 |
| 2018 | $22,608 | $1,581,000 | $612,000 | $969,000 |
| 2017 | $10,998 | $759,000 | $521,000 | $238,000 |
| 2016 | $9,402 | $644,000 | $496,000 | $148,000 |
| 2015 | $9,228 | $621,000 | $451,000 | $170,000 |
| 2014 | $9,259 | $597,000 | $410,000 | $187,000 |
Source: Public Records
Map
Nearby Homes