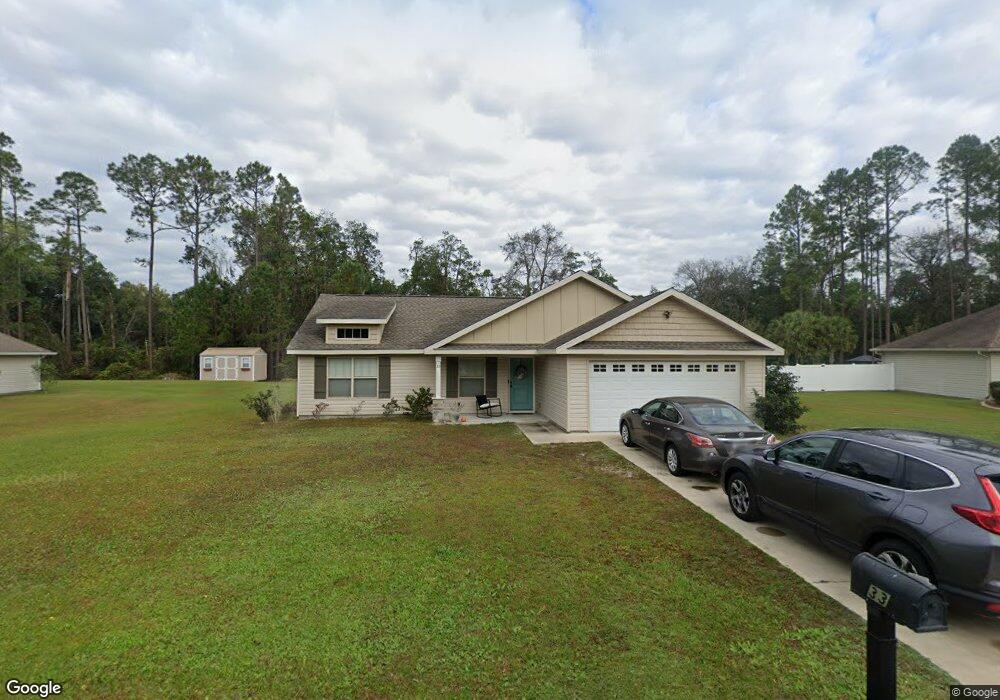
33 Wild Game Ct Unit Lot 47 Brunswick, GA 31525
Estimated Value: $305,250 - $336,000
4
Beds
2
Baths
1,564
Sq Ft
$206/Sq Ft
Est. Value
About This Home
This home is located at 33 Wild Game Ct Unit Lot 47, Brunswick, GA 31525 and is currently estimated at $322,563, approximately $206 per square foot. 33 Wild Game Ct Unit Lot 47 is a home located in Glynn County with nearby schools including Sterling Elementary School, Jane Macon Middle School, and Brunswick High School.
Ownership History
Date
Name
Owned For
Owner Type
Purchase Details
Closed on
Nov 8, 2018
Sold by
Regency Innovations Llc
Bought by
Moore Austin J and Moore Maria C
Current Estimated Value
Home Financials for this Owner
Home Financials are based on the most recent Mortgage that was taken out on this home.
Original Mortgage
$188,787
Outstanding Balance
$164,979
Interest Rate
4.9%
Mortgage Type
New Conventional
Estimated Equity
$157,584
Purchase Details
Closed on
Aug 7, 2018
Sold by
Gardner George
Bought by
Regency Innovations Llc
Home Financials for this Owner
Home Financials are based on the most recent Mortgage that was taken out on this home.
Original Mortgage
$125,000
Interest Rate
4.5%
Mortgage Type
New Conventional
Purchase Details
Closed on
Apr 13, 2018
Sold by
Regency Innovations Llc
Bought by
Gardner George
Purchase Details
Closed on
Jan 29, 2007
Sold by
Satilla Forest Develoment
Bought by
Wild Game Llc
Create a Home Valuation Report for This Property
The Home Valuation Report is an in-depth analysis detailing your home's value as well as a comparison with similar homes in the area
Home Values in the Area
Average Home Value in this Area
Purchase History
| Date | Buyer | Sale Price | Title Company |
|---|---|---|---|
| Moore Austin J | $186,900 | -- | |
| Regency Innovations Llc | -- | -- | |
| Gardner George | -- | -- | |
| Regency Innovations Llc | $15,000 | -- | |
| Wild Game Llc | $650,000 | -- |
Source: Public Records
Mortgage History
| Date | Status | Borrower | Loan Amount |
|---|---|---|---|
| Open | Moore Austin J | $188,787 | |
| Previous Owner | Regency Innovations Llc | $125,000 |
Source: Public Records
Tax History Compared to Growth
Tax History
| Year | Tax Paid | Tax Assessment Tax Assessment Total Assessment is a certain percentage of the fair market value that is determined by local assessors to be the total taxable value of land and additions on the property. | Land | Improvement |
|---|---|---|---|---|
| 2025 | $2,805 | $111,840 | $6,400 | $105,440 |
| 2024 | $2,805 | $111,840 | $6,400 | $105,440 |
| 2023 | $1,454 | $101,920 | $6,400 | $95,520 |
| 2022 | $1,872 | $89,200 | $6,400 | $82,800 |
| 2021 | $1,927 | $74,680 | $5,800 | $68,880 |
| 2020 | $1,943 | $74,680 | $5,800 | $68,880 |
| 2019 | $1,943 | $74,680 | $5,800 | $68,880 |
| 2018 | $145 | $5,560 | $5,560 | $0 |
| 2017 | $128 | $4,920 | $4,920 | $0 |
| 2016 | $162 | $6,760 | $6,760 | $0 |
| 2015 | $87 | $3,600 | $3,600 | $0 |
| 2014 | $87 | $3,600 | $3,600 | $0 |
Source: Public Records
Map
Nearby Homes
- 125 Greencove Dr
- 203 Green Cove Dr
- 203 Greencove Dr
- 197 Acorn Dr
- 10032 Woodland Cove
- The Dogwood Plan at Woodland Cove
- 11033 Woodland Trail
- The Magnolia Plan at Woodland Cove
- 11026 Woodland Trail
- 10016 Woodland Cove
- Richmond Plan at The Gallery at Coastal Pines
- 182 Sweetwater Blvd
- 67 E Chapel Dr
- 46 E Chapel Dr
- 48 E Chapel Dr
- 52 E Chapel Dr
- 62 E Chapel Dr
- The Aspen Plan at Sweetwater
- The Dogwood Plan at Sweetwater
- The Magnolia Plan at Sweetwater
- 33 Wild Game Ct
- 33 Wild Game Ct
- 29 Wild Game Ct
- 37 Wild Game Ct
- 23 Wild Game Ct
- 34 Wild Game Ct
- 41 Wild Game Ct Unit Lot 49
- 41 Wild Game Ct
- 41 Wild Game Ct
- 28 Wild Game Ct
- 42 Wild Game Ct
- 24 Wild Game Ct
- 19 Wild Game Ct
- 43 Wild Game Ct
- 20 Wild Game Ct
- 20 Wild Game Court (The Strutt)
- 46 Wild Game Ct
- LOT 40 Greencove
- 14 Wilderness Trail
- 132 Greencove Dr Unit Lot 42