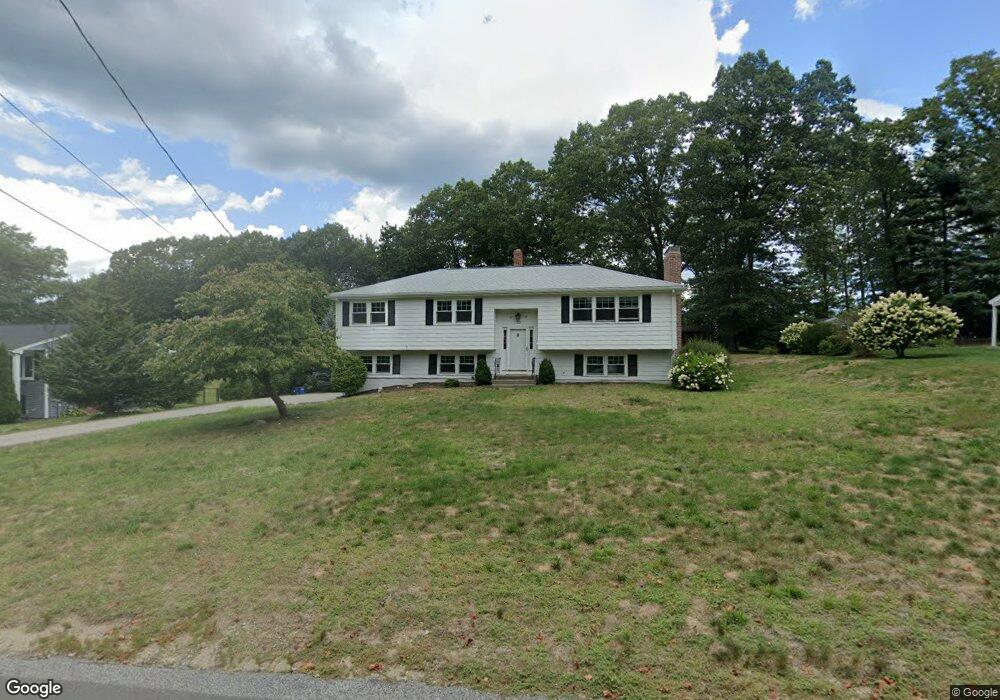
33 Woodlock Rd Hingham, MA 02043
Estimated Value: $950,000 - $1,208,000
3
Beds
3
Baths
1,338
Sq Ft
$777/Sq Ft
Est. Value
About This Home
This home is located at 33 Woodlock Rd, Hingham, MA 02043 and is currently estimated at $1,039,250, approximately $776 per square foot. 33 Woodlock Rd is a home located in Plymouth County with nearby schools including Plymouth River Elementary School, Hingham Middle School, and Hingham High School.
Ownership History
Date
Name
Owned For
Owner Type
Purchase Details
Closed on
Aug 20, 2001
Sold by
Smith Christopher B and Smith Laura A
Bought by
Fetsko Elizabeth D and Fetsko Stephen W
Current Estimated Value
Purchase Details
Closed on
Dec 17, 1999
Sold by
English Max A and English Marion A
Bought by
Smith Christopher B and Smith Laura A
Purchase Details
Closed on
Sep 27, 1996
Sold by
Carpenter Terrone D and Carpenter Elaine M
Bought by
English Max A and English Marion A
Create a Home Valuation Report for This Property
The Home Valuation Report is an in-depth analysis detailing your home's value as well as a comparison with similar homes in the area
Purchase History
| Date | Buyer | Sale Price | Title Company |
|---|---|---|---|
| Fetsko Elizabeth D | $365,000 | -- | |
| Smith Christopher B | $302,000 | -- | |
| English Max A | $210,000 | -- |
Source: Public Records
Mortgage History
| Date | Status | Borrower | Loan Amount |
|---|---|---|---|
| Open | English Max A | $340,000 | |
| Closed | English Max A | $125,000 |
Source: Public Records
Tax History Compared to Growth
Tax History
| Year | Tax Paid | Tax Assessment Tax Assessment Total Assessment is a certain percentage of the fair market value that is determined by local assessors to be the total taxable value of land and additions on the property. | Land | Improvement |
|---|---|---|---|---|
| 2025 | $9,054 | $847,000 | $576,000 | $271,000 |
| 2024 | $8,888 | $819,200 | $576,000 | $243,200 |
| 2023 | $7,309 | $730,900 | $504,000 | $226,900 |
| 2022 | $7,094 | $613,700 | $400,000 | $213,700 |
| 2021 | $3,494 | $652,200 | $460,000 | $192,200 |
| 2020 | $7,465 | $647,400 | $460,000 | $187,400 |
| 2019 | $6,061 | $513,200 | $352,000 | $161,200 |
| 2018 | $2,778 | $509,900 | $352,000 | $157,900 |
| 2017 | $2,635 | $524,900 | $360,000 | $164,900 |
| 2016 | $6,762 | $541,400 | $342,900 | $198,500 |
| 2015 | $6,581 | $525,200 | $326,700 | $198,500 |
Source: Public Records
Map
Nearby Homes
- 9 Cranberry Ln
- 249 High St
- 38 School St Unit 2
- 31 School St
- 6 Brewer Way
- 2 Black Rock Dr Unit 21
- 2 Black Rock Dr
- 43 Filomena St
- 38 Smith Rd
- 425 East St
- 38 Twilight Path
- 56 Putnam St
- 86 Black Rock Dr
- 30 Puritan Rd
- 575 Broad St Unit 305
- 575 Broad St Unit 215
- 573 Broad St Unit 325
- 178 Hersey St
- 955 Pleasant St Unit 11
- 10 Colby Rd
- 31 Woodlock Rd
- 35 Woodlock Rd
- 26 Woodlock Rd
- 24 Woodlock Rd
- 37 Woodlock Rd
- 7 Ridgewood Crossing
- 7 Ridgewood Crossing Unit MODEldridge
- 7 Ridgewood Crossing Unit 7
- 7 Ridgewood Crossing Unit Mod Eld
- 28 Woodlock Rd
- 5 Ridgewood Crossing
- 29 Woodlock Rd
- 9 Ridgewood Crossing
- 9 Ridgewood Crossing Unit Cushing
- 9 Ridgewood Crossing Unit Brewer
- 22 Woodlock Rd
- 11 Ridgewood Crossing
- 3 Ridgewood Crossing
- 39 Woodlock Rd
- 30 Woodlock Rd