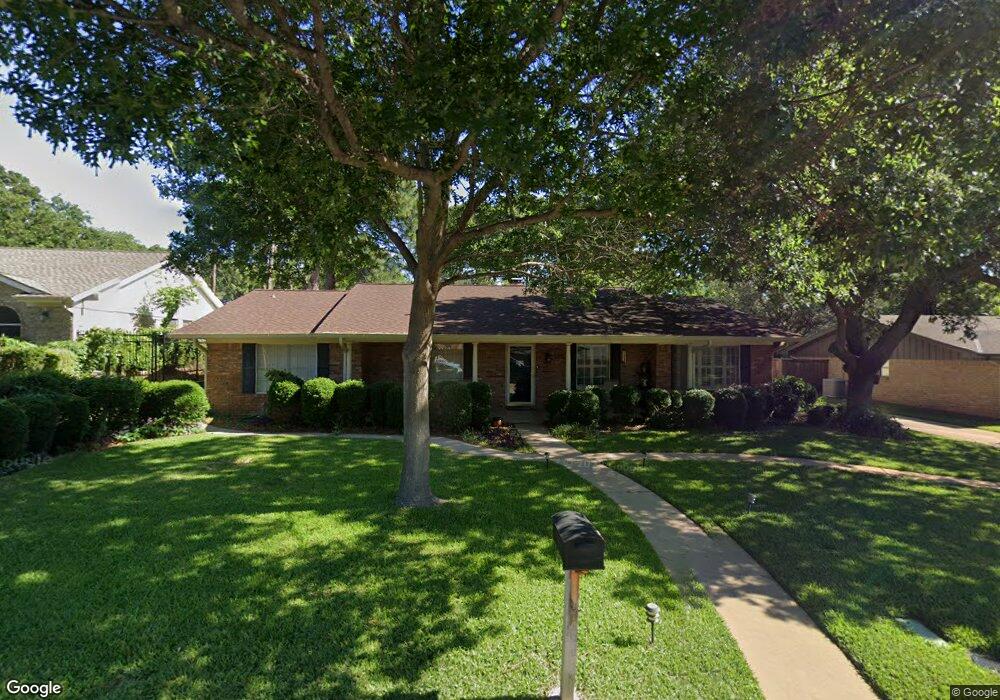
33 Yorkshire Bedford, TX 76021
Estimated Value: $374,055 - $448,000
3
Beds
2
Baths
2,160
Sq Ft
$195/Sq Ft
Est. Value
About This Home
This home is located at 33 Yorkshire, Bedford, TX 76021 and is currently estimated at $420,264, approximately $194 per square foot. 33 Yorkshire is a home located in Tarrant County with nearby schools including Shady Brook Elementary School, Harwood Junior High School, and Trinity High School.
Ownership History
Date
Name
Owned For
Owner Type
Purchase Details
Closed on
Jun 27, 2014
Sold by
Paiboon Shuship and Paiboon Kristy
Bought by
Rigdon Stephen and Rigdon Virgina
Current Estimated Value
Purchase Details
Closed on
Aug 1, 2001
Sold by
Paschall Clint and Paschall Ionia
Bought by
Paiboon Shuship and Paiboon Kristy
Home Financials for this Owner
Home Financials are based on the most recent Mortgage that was taken out on this home.
Original Mortgage
$145,350
Interest Rate
7.05%
Purchase Details
Closed on
Feb 27, 2001
Sold by
Poe Rick J and Poe Nan
Bought by
Paschall Clint and Paschall Tonia
Home Financials for this Owner
Home Financials are based on the most recent Mortgage that was taken out on this home.
Original Mortgage
$148,410
Interest Rate
7.1%
Create a Home Valuation Report for This Property
The Home Valuation Report is an in-depth analysis detailing your home's value as well as a comparison with similar homes in the area
Home Values in the Area
Average Home Value in this Area
Purchase History
| Date | Buyer | Sale Price | Title Company |
|---|---|---|---|
| Rigdon Stephen | -- | Rtt | |
| Paiboon Shuship | -- | American Title Co | |
| Paschall Clint | -- | Republic Title Of Texas Inc |
Source: Public Records
Mortgage History
| Date | Status | Borrower | Loan Amount |
|---|---|---|---|
| Previous Owner | Paiboon Shuship | $145,350 | |
| Previous Owner | Paschall Clint | $148,410 |
Source: Public Records
Tax History
| Year | Tax Paid | Tax Assessment Tax Assessment Total Assessment is a certain percentage of the fair market value that is determined by local assessors to be the total taxable value of land and additions on the property. | Land | Improvement |
|---|---|---|---|---|
| 2025 | $825 | $290,418 | $75,000 | $215,418 |
| 2024 | $825 | $290,418 | $75,000 | $215,418 |
| 2023 | $4,450 | $250,660 | $75,000 | $175,660 |
| 2022 | $1,635 | $210,922 | $75,000 | $135,922 |
| 2021 | $4,752 | $243,727 | $75,000 | $168,727 |
| 2020 | $4,360 | $249,000 | $75,000 | $174,000 |
| 2019 | $4,050 | $249,000 | $75,000 | $174,000 |
| 2018 | $1,502 | $151,551 | $75,000 | $76,551 |
| 2017 | $3,333 | $214,500 | $25,000 | $189,500 |
| 2016 | $3,030 | $174,964 | $25,000 | $149,964 |
| 2015 | $3,261 | $113,863 | $25,000 | $88,863 |
| 2014 | $3,261 | $140,800 | $25,000 | $115,800 |
Source: Public Records
Map
Nearby Homes
- 1630 Post Oak Dr
- 21 Devonshire Dr
- 1724 Post Oak Dr
- 17 Lincolnshire Cir
- 2901 Miles Way
- 22 Lincolnshire Cir
- 2528 Sunshine Ct
- 2505 Shady Ridge Dr
- 2701 Clearmeadow Ct
- 2109 Oakmeadow St
- 1252 Royal Crescent Dr
- 1801 Glenbrook Ct
- 3 Dewberry Ct
- 2941 Eagles Nest Dr
- 104 Morrow Dr
- 2912 Weslyan Oak St
- 51 Morrow Dr
- 1800 Hampton Dr
- 1105 Springdale Rd
- 3528 Meadowside Dr
- 29 Yorkshire
- 37 Yorkshire
- 50 Devonshire Dr
- 2713 Bedfordshire
- 42 Devonshire Dr
- 25 Yorkshire
- 54 Devonshire Dr
- 14 Yorkshire
- 38 Devonshire Dr
- 2709 Bedfordshire
- 2800 Bedfordshire
- 2804 Bedfordshire
- 2712 Bedfordshire
- 2808 Bedfordshire
- 21 Yorkshire
- 57 Devonshire Dr
- 10 Yorkshire
- 61 Devonshire Dr
- 2708 Bedfordshire
- 34 Devonshire Dr
Your Personal Tour Guide
Ask me questions while you tour the home.