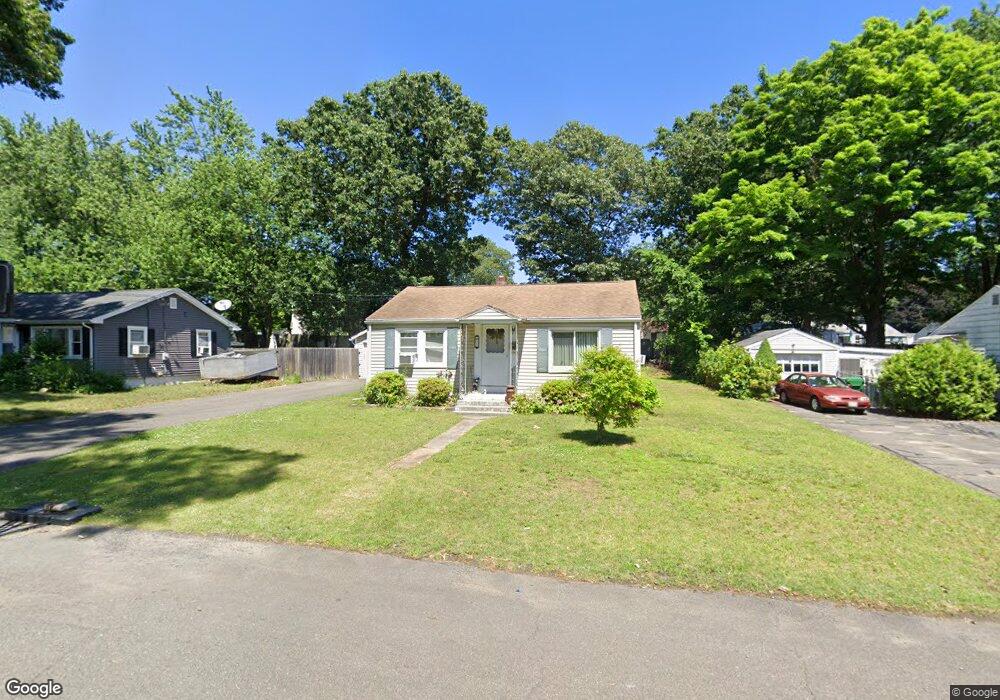
33 Yvette St Chicopee, MA 01020
Fairview NeighborhoodEstimated Value: $285,000 - $305,000
2
Beds
3
Baths
1,040
Sq Ft
$286/Sq Ft
Est. Value
About This Home
This home is located at 33 Yvette St, Chicopee, MA 01020 and is currently estimated at $297,034, approximately $285 per square foot. 33 Yvette St is a home located in Hampden County with nearby schools including Streiber Elementary School, Fairview Middle School, and Chicopee Comprehensive High School.
Ownership History
Date
Name
Owned For
Owner Type
Purchase Details
Closed on
Jun 29, 2015
Sold by
Manning David M
Bought by
Manning Lori A
Current Estimated Value
Purchase Details
Closed on
Oct 26, 2012
Sold by
Manning David M and Manning Lori A
Bought by
Manning David M and Manning Lori A
Purchase Details
Closed on
Aug 25, 1999
Sold by
Loudon Thomas M
Bought by
Shelter Solutions Inc
Home Financials for this Owner
Home Financials are based on the most recent Mortgage that was taken out on this home.
Original Mortgage
$100,450
Interest Rate
7.53%
Mortgage Type
Purchase Money Mortgage
Create a Home Valuation Report for This Property
The Home Valuation Report is an in-depth analysis detailing your home's value as well as a comparison with similar homes in the area
Home Values in the Area
Average Home Value in this Area
Purchase History
| Date | Buyer | Sale Price | Title Company |
|---|---|---|---|
| Manning Lori A | -- | -- | |
| Manning David M | -- | -- | |
| Shelter Solutions Inc | $100,550 | -- |
Source: Public Records
Mortgage History
| Date | Status | Borrower | Loan Amount |
|---|---|---|---|
| Previous Owner | Shelter Solutions Inc | $100,450 |
Source: Public Records
Tax History
| Year | Tax Paid | Tax Assessment Tax Assessment Total Assessment is a certain percentage of the fair market value that is determined by local assessors to be the total taxable value of land and additions on the property. | Land | Improvement |
|---|---|---|---|---|
| 2025 | $3,441 | $227,000 | $101,500 | $125,500 |
| 2024 | $3,269 | $221,500 | $99,500 | $122,000 |
| 2023 | $3,104 | $204,900 | $90,500 | $114,400 |
| 2022 | $2,992 | $176,100 | $78,700 | $97,400 |
| 2021 | $2,849 | $161,800 | $71,600 | $90,200 |
| 2020 | $2,766 | $158,400 | $73,500 | $84,900 |
| 2019 | $2,748 | $153,000 | $73,500 | $79,500 |
| 2018 | $2,655 | $145,000 | $70,000 | $75,000 |
| 2017 | $2,635 | $152,200 | $65,800 | $86,400 |
| 2016 | $2,765 | $163,500 | $65,800 | $97,700 |
| 2015 | $2,666 | $152,000 | $65,800 | $86,200 |
| 2014 | -- | $152,000 | $65,800 | $86,200 |
Source: Public Records
Map
Nearby Homes
- 442 Prospect St
- 83 Old Farm Rd
- 84 Montcalm St
- 67 Streiber Dr
- 460 Irene St
- 119 Oakridge St
- 81 Mccarthy Ave
- 15 Hudson Ave
- 61 Saint Jacques Ave
- 88 Prospect St
- 52 Falmouth Rd
- 47 N Canal St
- 58 Robinridge Rd
- 143 Royal St
- 35 Ludlow Rd
- 104 Johnson Rd Unit 1103
- 104 Johnson Rd Unit 707
- 18 Devlin Dr
- 41 Susan Ave
- 70 Greenwood Terrace
Your Personal Tour Guide
Ask me questions while you tour the home.