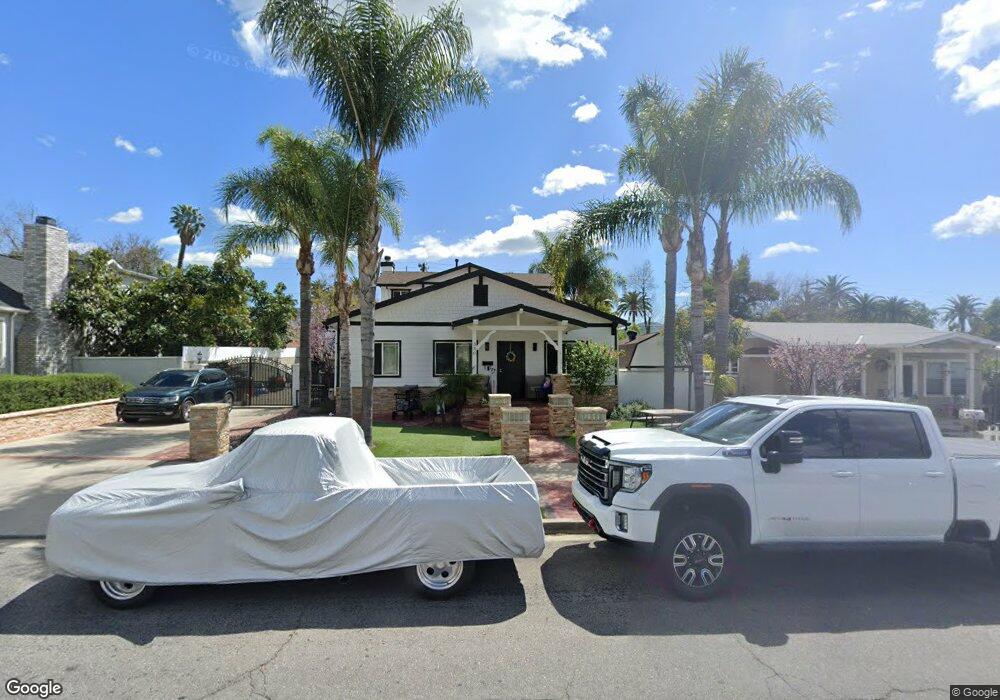
330 4th St Fillmore, CA 93015
Estimated Value: $774,062 - $1,053,000
4
Beds
3
Baths
2,729
Sq Ft
$330/Sq Ft
Est. Value
About This Home
This home is located at 330 4th St, Fillmore, CA 93015 and is currently estimated at $901,766, approximately $330 per square foot. 330 4th St is a home located in Ventura County with nearby schools including San Cayetano Elementary School and Fillmore Senior High.
Ownership History
Date
Name
Owned For
Owner Type
Purchase Details
Closed on
Jan 26, 2018
Sold by
Felix Noe M and Felix Maria A
Bought by
Felix Noe M and Felix Maria A
Current Estimated Value
Purchase Details
Closed on
Jul 23, 2001
Sold by
Ballard Shannon L
Bought by
Felix Noe M and Felix Maria A
Home Financials for this Owner
Home Financials are based on the most recent Mortgage that was taken out on this home.
Original Mortgage
$167,000
Outstanding Balance
$64,404
Interest Rate
7.15%
Estimated Equity
$837,362
Purchase Details
Closed on
Jun 30, 1995
Sold by
City Of Fillmore
Bought by
Johnson Alfred K
Create a Home Valuation Report for This Property
The Home Valuation Report is an in-depth analysis detailing your home's value as well as a comparison with similar homes in the area
Home Values in the Area
Average Home Value in this Area
Purchase History
We collect this data history from publicly available records. To have your information removed, we recommend requesting removal directly through your county’s website.
| Date | Buyer | Sale Price | Title Company |
|---|---|---|---|
| Felix Noe M | -- | None Available | |
| Felix Noe M | -- | None Available | |
| Felix Noe M | $187,000 | First American Title Ins Co | |
| Johnson Alfred K | -- | -- |
Source: Public Records
Mortgage History
We collect this data history from publicly available records. To have your information removed, we recommend requesting removal directly through your county’s website.
| Date | Status | Borrower | Loan Amount |
|---|---|---|---|
| Open | Felix Noe M | $167,000 |
Source: Public Records
Tax History
| Year | Tax Paid | Tax Assessment Tax Assessment Total Assessment is a certain percentage of the fair market value that is determined by local assessors to be the total taxable value of land and additions on the property. | Land | Improvement |
|---|---|---|---|---|
| 2025 | $5,097 | $467,030 | $162,489 | $304,541 |
| 2024 | $5,097 | $457,873 | $159,303 | $298,570 |
| 2023 | $5,026 | $448,896 | $156,180 | $292,716 |
| 2022 | $4,644 | $440,095 | $153,118 | $286,977 |
| 2021 | $5,283 | $431,466 | $150,116 | $281,350 |
| 2020 | $4,899 | $427,044 | $148,578 | $278,466 |
| 2019 | $4,912 | $418,671 | $145,665 | $273,006 |
| 2018 | $4,812 | $410,462 | $142,809 | $267,653 |
| 2017 | $4,838 | $402,414 | $140,009 | $262,405 |
| 2016 | $4,477 | $394,524 | $137,264 | $257,260 |
| 2015 | $4,351 | $388,600 | $135,203 | $253,397 |
| 2014 | $4,347 | $380,989 | $132,555 | $248,434 |
Source: Public Records
Map
Nearby Homes
- 639 Clay St
- 503 Arundell Cir
- 639 Mountain View St
- 1000 Foothill Dr
- 809 Woodgrove Rd
- 815 Woodgrove Rd
- 444 Mountain View St
- 300 Fillmore St
- 553 Sespe Ave
- 340 Central Ave
- 1106 Shadow Ridge Way
- 158 Arborwood St
- 232 River St
- 135 Surrey Way
- 512 Mulberry Ln
- 534 Mulberry Ln
- 915 E Telegraph Rd
- 3040 E Telegraph Rd
- 250 E Telegraph Rd Unit 200
- 250 E Telegraph Rd Unit 307
Your Personal Tour Guide
Ask me questions while you tour the home.