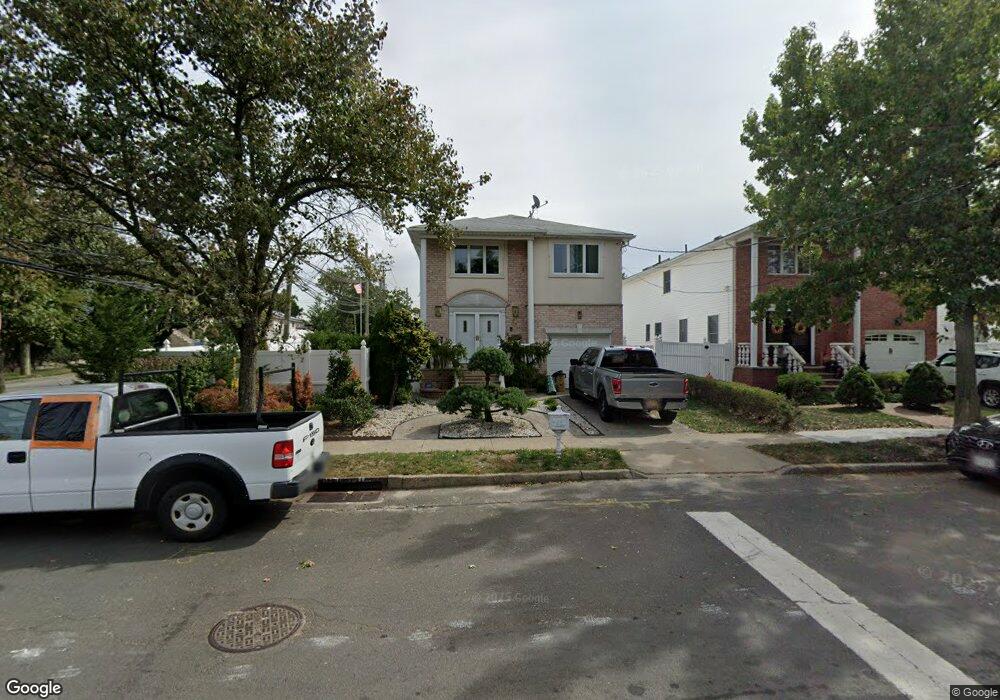
330 Amber St Staten Island, NY 10306
Great Kills NeighborhoodEstimated Value: $672,000 - $1,100,000
4
Beds
4
Baths
3,496
Sq Ft
$267/Sq Ft
Est. Value
About This Home
This home is located at 330 Amber St, Staten Island, NY 10306 and is currently estimated at $933,420, approximately $266 per square foot. 330 Amber St is a home located in Richmond County with nearby schools including P.S. 23 Richmondtown, Myra S. Barnes Intermediate School 24, and Susan E Wagner High School.
Ownership History
Date
Name
Owned For
Owner Type
Purchase Details
Closed on
Feb 13, 2025
Sold by
Sniadowski Lance and Bonat Aneta
Bought by
Sniadowski Lance
Current Estimated Value
Purchase Details
Closed on
May 4, 2023
Sold by
Sniadowski Lance
Bought by
Sniadowski Lance and Bonat Aneta
Purchase Details
Closed on
Apr 21, 2022
Sold by
Halina Tomczyk
Bought by
Sniadowski Lance
Purchase Details
Closed on
Jun 9, 1999
Sold by
Scialpi Dennis
Bought by
Tomczyk Halina
Home Financials for this Owner
Home Financials are based on the most recent Mortgage that was taken out on this home.
Original Mortgage
$247,000
Interest Rate
6.25%
Mortgage Type
Unknown
Purchase Details
Closed on
Jan 5, 1996
Sold by
Blue Star Estates Inc
Bought by
Scialpi Dennis
Create a Home Valuation Report for This Property
The Home Valuation Report is an in-depth analysis detailing your home's value as well as a comparison with similar homes in the area
Home Values in the Area
Average Home Value in this Area
Purchase History
| Date | Buyer | Sale Price | Title Company |
|---|---|---|---|
| Sniadowski Lance | -- | Security Title | |
| Sniadowski Lance | -- | The Security Title Guarantee | |
| Sniadowski Lance | $499,000 | None Listed On Document | |
| Tomczyk Halina | $377,500 | Old Republic Natl Title Ins | |
| Scialpi Dennis | $328,000 | -- |
Source: Public Records
Mortgage History
| Date | Status | Borrower | Loan Amount |
|---|---|---|---|
| Previous Owner | Tomczyk Halina | $247,000 |
Source: Public Records
Tax History Compared to Growth
Tax History
| Year | Tax Paid | Tax Assessment Tax Assessment Total Assessment is a certain percentage of the fair market value that is determined by local assessors to be the total taxable value of land and additions on the property. | Land | Improvement |
|---|---|---|---|---|
| 2025 | $10,991 | $63,360 | $14,281 | $49,079 |
| 2024 | $10,991 | $57,780 | $14,774 | $43,006 |
| 2023 | $11,113 | $54,720 | $12,602 | $42,118 |
| 2022 | $9,823 | $56,700 | $15,600 | $41,100 |
| 2021 | $4,501 | $53,040 | $15,600 | $37,440 |
| 2020 | $4,457 | $52,440 | $15,600 | $36,840 |
| 2019 | $9,246 | $45,600 | $15,600 | $30,000 |
| 2018 | $9,157 | $46,381 | $13,893 | $32,488 |
| 2017 | $8,620 | $43,756 | $15,250 | $28,506 |
| 2016 | $7,942 | $41,280 | $15,600 | $25,680 |
| 2015 | $8,134 | $44,308 | $12,311 | $31,997 |
| 2014 | $8,134 | $43,974 | $20,883 | $23,091 |
Source: Public Records
Map
Nearby Homes
- 330 Amber St
- 334 Amber St
- 338 Amber St
- 174 Clarke Ave
- 342 Amber St
- 175 Clarke Ave
- 168 Clarke Ave
- 161 Clarke Ave
- 41 Boyce Ave
- 346 Amber St
- 157 Clarke Ave
- 39 Boyce Ave
- 74 W Cedarview Ave
- 315 Amber St
- 37 Boyce Ave
- 156 Clarke Ave
- 196 Clarke Ave
- 251 Wolverine St
- 72 W Cedarview Ave Unit 1fl
- 72 W Cedarview Ave