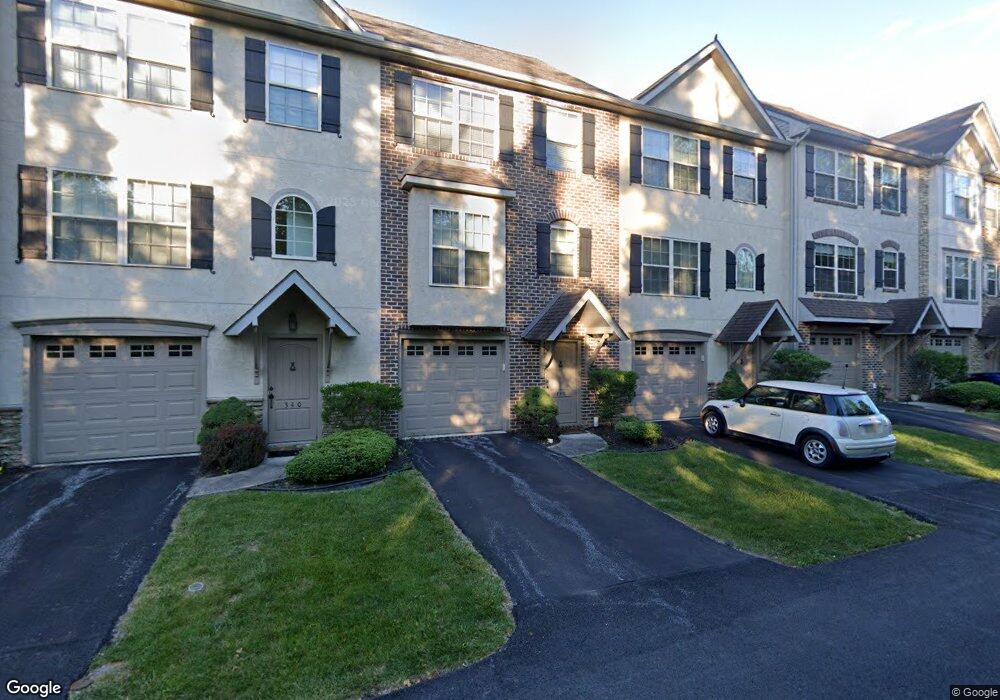
330 Blackhorse Dr Unit 330 Red Lion, PA 17356
Estimated Value: $243,000 - $270,000
2
Beds
3
Baths
1,540
Sq Ft
$166/Sq Ft
Est. Value
About This Home
This home is located at 330 Blackhorse Dr Unit 330, Red Lion, PA 17356 and is currently estimated at $256,101, approximately $166 per square foot. 330 Blackhorse Dr Unit 330 is a home located in York County with nearby schools including Ore Valley Elementary School, Dallastown Area Middle School, and Dallastown Area High School.
Ownership History
Date
Name
Owned For
Owner Type
Purchase Details
Closed on
Aug 22, 2024
Sold by
Winters David R
Bought by
Hunt Christopher P
Current Estimated Value
Home Financials for this Owner
Home Financials are based on the most recent Mortgage that was taken out on this home.
Original Mortgage
$227,950
Outstanding Balance
$225,321
Interest Rate
6.77%
Mortgage Type
New Conventional
Estimated Equity
$30,780
Purchase Details
Closed on
Feb 3, 2006
Sold by
The Townes At Carriage Crossings Lp
Bought by
Winters David R
Home Financials for this Owner
Home Financials are based on the most recent Mortgage that was taken out on this home.
Original Mortgage
$162,000
Interest Rate
6.31%
Mortgage Type
Purchase Money Mortgage
Purchase Details
Closed on
Jul 13, 2005
Sold by
Cornerstone At Carriage Crossings Lp
Bought by
The Townes At Carriage Crossings Lp
Create a Home Valuation Report for This Property
The Home Valuation Report is an in-depth analysis detailing your home's value as well as a comparison with similar homes in the area
Home Values in the Area
Average Home Value in this Area
Purchase History
| Date | Buyer | Sale Price | Title Company |
|---|---|---|---|
| Hunt Christopher P | $235,000 | Guaranteed Trust Title | |
| Winters David R | $182,802 | None Available | |
| The Townes At Carriage Crossings Lp | $266,000 | -- |
Source: Public Records
Mortgage History
| Date | Status | Borrower | Loan Amount |
|---|---|---|---|
| Open | Hunt Christopher P | $227,950 | |
| Previous Owner | Winters David R | $162,000 |
Source: Public Records
Tax History Compared to Growth
Tax History
| Year | Tax Paid | Tax Assessment Tax Assessment Total Assessment is a certain percentage of the fair market value that is determined by local assessors to be the total taxable value of land and additions on the property. | Land | Improvement |
|---|---|---|---|---|
| 2025 | $5,357 | $156,070 | $0 | $156,070 |
| 2024 | $5,279 | $156,070 | $0 | $156,070 |
| 2023 | $5,279 | $156,070 | $0 | $156,070 |
| 2022 | $5,107 | $156,070 | $0 | $156,070 |
| 2021 | $4,865 | $156,070 | $0 | $156,070 |
| 2020 | $4,865 | $156,070 | $0 | $156,070 |
| 2019 | $4,849 | $156,070 | $0 | $156,070 |
| 2018 | $4,816 | $156,070 | $0 | $156,070 |
| 2017 | $4,624 | $156,070 | $0 | $156,070 |
| 2016 | $0 | $156,070 | $0 | $156,070 |
| 2015 | -- | $156,070 | $0 | $156,070 |
| 2014 | -- | $156,070 | $0 | $156,070 |
Source: Public Records
Map
Nearby Homes
- 400 Carriage Ln Unit 400
- 137 Furlong Way
- 300 N Franklin St
- 214 Equine Cove Unit 214
- 338 Atlantic Ave
- 415 N Main St
- 3366 Cape Horn Rd
- 270 N Main St
- 321 Atlantic Ave
- 0 Cape Horn Rd
- 503 W Broadway
- 840 Country Club Rd
- 81 1st Ave Unit E
- 79 1st Ave
- 630 Woodland Ave
- 131 Country Ridge Dr
- 126 Country Ridge Dr
- 1012 Woodridge Rd
- 220 W Broadway
- 314 Boundary Ave
- 320 Blackhorse Dr Unit 320
- 310 Blackhorse Dr Unit 310
- 340 Blackhorse Dr Unit 340
- 300 Blackhorse Dr Unit 300
- 350 Blackhorse Dr Unit 350
- 360 Blackhorse Dr Unit 360
- 500 Bridal Path Ln Unit 500
- 510 Bridal Path Ln Unit 510
- 520 Bridal Path Ln Unit 520
- 530 Bridal Path Ln Unit 530
- 550 Bridal Path Ln Unit 550
- 100 Valley Dr Unit 100
- 420 Carriage Ln Unit 420
- 110 Valley Dr Unit 110
- 560 Bridal Path Ln Unit 560
- 120 Valley Dr Unit 120
- 430 Carriage Ln
- 440 Carriage Ln Unit 440
- 120 and 250 Valley Dr
- 130 Valley Dr Unit 130