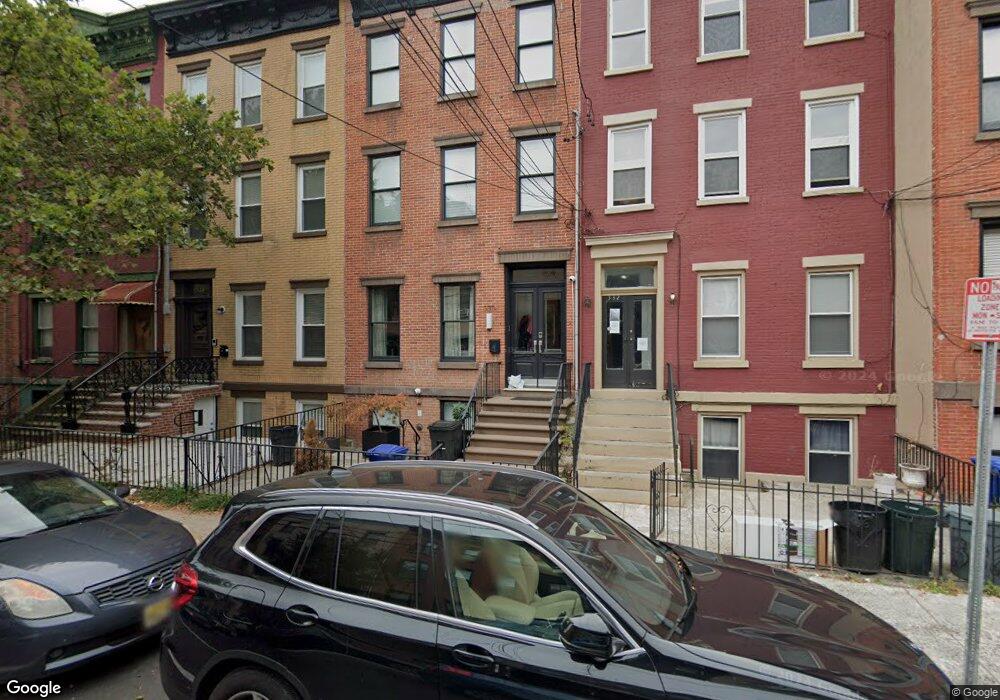
330 Bloomfield St Unit 2 Hoboken, NJ 07030
Estimated Value: $3,129,000 - $3,579,489
1
Bed
1
Bath
500
Sq Ft
$6,786/Sq Ft
Est. Value
About This Home
This home is located at 330 Bloomfield St Unit 2, Hoboken, NJ 07030 and is currently estimated at $3,393,122, approximately $6,786 per square foot. 330 Bloomfield St Unit 2 is a home located in Hudson County with nearby schools including Hoboken High School, Hoboken Charter School, and Stevens Cooperative School.
Ownership History
Date
Name
Owned For
Owner Type
Purchase Details
Closed on
Oct 5, 2023
Sold by
Temkin David and Bohan Peter
Bought by
Temkin David
Current Estimated Value
Purchase Details
Closed on
Sep 14, 2018
Sold by
Robison Cox Noah J and Robison Cox Jean Kim
Bought by
Temkin David and Bohan Peter
Home Financials for this Owner
Home Financials are based on the most recent Mortgage that was taken out on this home.
Original Mortgage
$2,092,000
Interest Rate
4.5%
Mortgage Type
New Conventional
Purchase Details
Closed on
Jan 7, 2016
Sold by
Kim Jean
Bought by
Robinson Cox Noah J and Robinson Cox Jean Kim
Home Financials for this Owner
Home Financials are based on the most recent Mortgage that was taken out on this home.
Original Mortgage
$975,000
Interest Rate
3.98%
Mortgage Type
New Conventional
Purchase Details
Closed on
Sep 8, 2008
Sold by
Us Bank National Association
Bought by
Kim Jean
Home Financials for this Owner
Home Financials are based on the most recent Mortgage that was taken out on this home.
Original Mortgage
$645,000
Interest Rate
5.75%
Mortgage Type
Purchase Money Mortgage
Purchase Details
Closed on
Feb 13, 2008
Sold by
Larosiliere Sacha
Bought by
U S Bank Na and Credit Suisse First Boston Csfb Armt 200
Purchase Details
Closed on
Oct 31, 2005
Sold by
Sandy Solange
Bought by
Larosillere Sacha
Purchase Details
Closed on
Jan 27, 2005
Sold by
Fiore Raymond J
Bought by
Sandy Solange
Home Financials for this Owner
Home Financials are based on the most recent Mortgage that was taken out on this home.
Original Mortgage
$115,000
Interest Rate
5.83%
Mortgage Type
Stand Alone Second
Purchase Details
Closed on
May 24, 2001
Sold by
Fiore Raymond and Fiore Jane
Bought by
Fiore Raymond
Purchase Details
Closed on
Oct 2, 1997
Sold by
Sabini Angelo and Baorto Adrienne
Bought by
Jefferson Association Llc
Create a Home Valuation Report for This Property
The Home Valuation Report is an in-depth analysis detailing your home's value as well as a comparison with similar homes in the area
Home Values in the Area
Average Home Value in this Area
Purchase History
| Date | Buyer | Sale Price | Title Company |
|---|---|---|---|
| Temkin David | -- | Fidelity National Title | |
| Temkin David | -- | Fidelity National Title | |
| Temkin David | $2,615,000 | Fidelity Natl Title Ins Co | |
| Robinson Cox Noah J | -- | None Available | |
| Kim Jean | $1,098,500 | -- | |
| U S Bank Na | -- | Land Title Services Nj Inc | |
| Larosillere Sacha | -- | None Available | |
| Sandy Solange | $1,150,000 | -- | |
| Fiore Raymond | -- | -- | |
| Jefferson Association Llc | $425,000 | -- |
Source: Public Records
Mortgage History
| Date | Status | Borrower | Loan Amount |
|---|---|---|---|
| Previous Owner | Temkin David | $2,092,000 | |
| Previous Owner | Robinson Cox Noah J | $975,000 | |
| Previous Owner | Kim Jean | $645,000 | |
| Previous Owner | Sandy Solange | $115,000 | |
| Previous Owner | Sandy Solange | $920,000 |
Source: Public Records
Tax History Compared to Growth
Tax History
| Year | Tax Paid | Tax Assessment Tax Assessment Total Assessment is a certain percentage of the fair market value that is determined by local assessors to be the total taxable value of land and additions on the property. | Land | Improvement |
|---|---|---|---|---|
| 2025 | $35,776 | $2,025,800 | $722,000 | $1,303,800 |
| 2024 | $33,000 | $2,025,800 | $722,000 | $1,303,800 |
| 2023 | $33,000 | $2,025,800 | $722,000 | $1,303,800 |
| 2022 | $32,413 | $2,025,800 | $722,000 | $1,303,800 |
| 2021 | $32,413 | $2,025,800 | $722,000 | $1,303,800 |
| 2020 | $24,426 | $2,025,800 | $722,000 | $1,303,800 |
| 2019 | $32,393 | $2,025,800 | $722,000 | $1,303,800 |
| 2018 | $32,008 | $2,025,800 | $722,000 | $1,303,800 |
| 2017 | $32,251 | $2,025,800 | $722,000 | $1,303,800 |
| 2016 | $31,420 | $2,025,800 | $722,000 | $1,303,800 |
| 2015 | $30,326 | $2,025,800 | $722,000 | $1,303,800 |
| 2014 | $28,928 | $2,025,800 | $722,000 | $1,303,800 |
Source: Public Records
Map
Nearby Homes
- 336 Bloomfield St Unit 2
- 305 Park Ave
- 217 Bloomfield St Unit 102
- 314 Hudson St Unit 2
- 422 Bloomfield St Unit 1R
- 300 Hudson St Unit 1
- 225 Park Ave Unit 1
- 225 Park Ave Unit 2
- 316 Park Ave Unit 2
- 160 2nd St Unit 4
- 500 Hudson St Unit 1
- 500 Hudson St Unit 2A
- 210 Park Ave Unit 400
- 115 Garden St Unit 3B
- 526 Hudson St
- 209 6th St Unit 200
- 110 Washington St Unit 8
- 118 Park Ave
- 152 6th St Unit 4
- 215 Clinton St Unit 1L
- 330 Bloomfield St
- 332 Bloomfield St
- 332 Bloomfield St Unit 3
- 332 Bloomfield St Unit 1
- 328 Bloomfield St
- 326 Bloomfield St
- 334 Bloomfield St
- 334 Bloomfield St Unit 3
- 334 Bloomfield St Unit 2
- 334 Bloomfield St Unit 1
- 336 Bloomfield St Unit 3
- 336 Bloomfield St
- 336 Bloomfield St
- 336 Bloomfield St Unit 4
- 324 Bloomfield St
- 324 Bloomfield St Unit Garden level
- 324 Bloomfield St Unit Garden
- 324 Bloomfield St Unit 4
- 324 Bloomfield St Unit 2
- 324 Bloomfield St Unit Grnd