


330 Buford Price Rd Wrightsville, GA 31096
Estimated payment $675/month
Highlights
- Greenhouse
- Wood Burning Stove
- Wood Flooring
- 1.37 Acre Lot
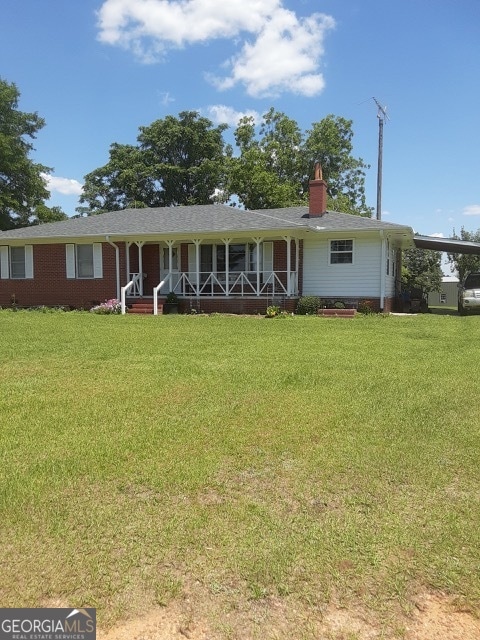
- Ranch Style House
- No HOA
About This Home
Welcome to this charming and cozy 3 bedroom, 1.5 bath home on 1.37 acres. Inside, you'll find a spacious living area with a wood-burning stove with blower, creating the perfect spot to relax on chilly evenings. The kitchen and dining room are combined in one open space, complete with new cabinets, countertops, and plank vinyl flooring. Hardwood floors are featured in the bedrooms, while the enclosed back porch provides extra living space. The property includes a drive-through carport plus multiple outbuildings: an 18'x19' shop, a 12'x18' appliance barn, a woodshed with firewood, a pump house/storage shed, and even a greenhouse to get a head start on your garden. Outdoors, enjoy fruit-bearing trees - fig, pear, pomegranate, persimmon, and pecan - along with multiple garden plots that could easily be brought back to life. This home combines character, functionality, and room to grow - making it a wonderful place to call home. **More Photos to come 8/27/28**
Home Details
Home Type
- Single Family
Est. Annual Taxes
- $810
Year Built
- Built in 1969
Lot Details
- 1.37 Acre Lot
- Garden
- Grass Covered Lot
Parking
- Carport
Home Design
- Ranch Style House
- Composition Roof
- Vinyl Siding
- Three Sided Brick Exterior Elevation
Interior Spaces
- 1,292 Sq Ft Home
- Ceiling Fan
- Wood Burning Stove
- Family Room
- Living Room with Fireplace
- Crawl Space
- Attic Fan
- Laundry in Kitchen
Flooring
- Wood
- Vinyl
Bedrooms and Bathrooms
- 3 Main Level Bedrooms
Outdoor Features
- Greenhouse
- Outbuilding
- Porch
Schools
- Johnson County Elementary And Middle School
- Johnson County High School
Utilities
- Window Unit Cooling System
- Heating System Uses Wood
- Heating System Uses Propane
- Propane
- Private Water Source
- Well
- Septic Tank
- High Speed Internet
- Phone Available
- Cable TV Available
Community Details
- No Home Owners Association
Map
Home Values in the Area
Average Home Value in this Area
Tax History
| Year | Tax Paid | Tax Assessment Tax Assessment Total Assessment is a certain percentage of the fair market value that is determined by local assessors to be the total taxable value of land and additions on the property. | Land | Improvement |
|---|---|---|---|---|
| 2024 | $611 | $26,279 | $1,707 | $24,572 |
| 2023 | $555 | $26,279 | $1,707 | $24,572 |
| 2022 | $555 | $26,279 | $1,707 | $24,572 |
| 2021 | $595 | $20,277 | $1,707 | $18,570 |
| 2020 | $623 | $20,277 | $1,707 | $18,570 |
| 2019 | $563 | $20,277 | $1,707 | $18,570 |
| 2018 | $595 | $20,277 | $1,707 | $18,570 |
| 2017 | $562 | $20,277 | $1,707 | $18,570 |
| 2016 | $595 | $20,277 | $1,707 | $18,570 |
| 2015 | -- | $23,215 | $1,707 | $21,508 |
| 2014 | -- | $23,215 | $1,707 | $21,508 |
| 2013 | -- | $23,214 | $1,706 | $21,508 |
Property History
| Date | Event | Price | Change | Sq Ft Price |
|---|---|---|---|---|
| 08/29/2025 08/29/25 | Pending | -- | -- | -- |
| 08/25/2025 08/25/25 | For Sale | $115,000 | -- | $89 / Sq Ft |
Purchase History
| Date | Type | Sale Price | Title Company |
|---|---|---|---|
| Quit Claim Deed | -- | -- | |
| Warranty Deed | $58,300 | -- | |
| Deed | $57,000 | -- | |
| Deed | -- | -- |
Mortgage History
| Date | Status | Loan Amount | Loan Type |
|---|---|---|---|
| Previous Owner | $59,553 | VA | |
| Previous Owner | $0 | New Conventional | |
| Previous Owner | $52,099 | New Conventional |
Source: Georgia MLS
MLS Number: 10590844
APN: 041-017
Disclaimer: Certain information contained herein is derived from information provided by parties other than Homes.com. All information provided is deemed reliable, but is not guaranteed to be accurate and should be independently verified.
![]() The data relating to real estate for sale on this web site comes in part from the Broker Reciprocity Program of Georgia MLS. Real estate listings held by brokerage firms other than Redfin are marked with the Broker Reciprocity logo and detailed information about them includes the name of the listing brokers. Information deemed reliable but not guaranteed. Copyright 2025 Georgia MLS. All rights reserved.
The data relating to real estate for sale on this web site comes in part from the Broker Reciprocity Program of Georgia MLS. Real estate listings held by brokerage firms other than Redfin are marked with the Broker Reciprocity logo and detailed information about them includes the name of the listing brokers. Information deemed reliable but not guaranteed. Copyright 2025 Georgia MLS. All rights reserved.
- 6400 Bartow-Dublin Rd
- 0 Bartow-Dublin Rd Unit 10559571
- 0 Bartow-Dublin Rd Unit 24028627
- 964 Cross Cedar Rd
- 230 Pringle Rd
- 1480 Smith Bedgood Rd
- 1000 May Rd
- 0 Shepard Rd
- 107 Wiggins St
- 1269 Tarver Rd
- 303 E Court St
- 8760 N Marcus St
- 8776 N Marcus St
- 11 Hill St
- 0 W Elm St
- 0 U S Highway 319
- 4772 Georgia 57
- 22 Jl Price Rd
- 6887 W College St
- 537 W Court St
