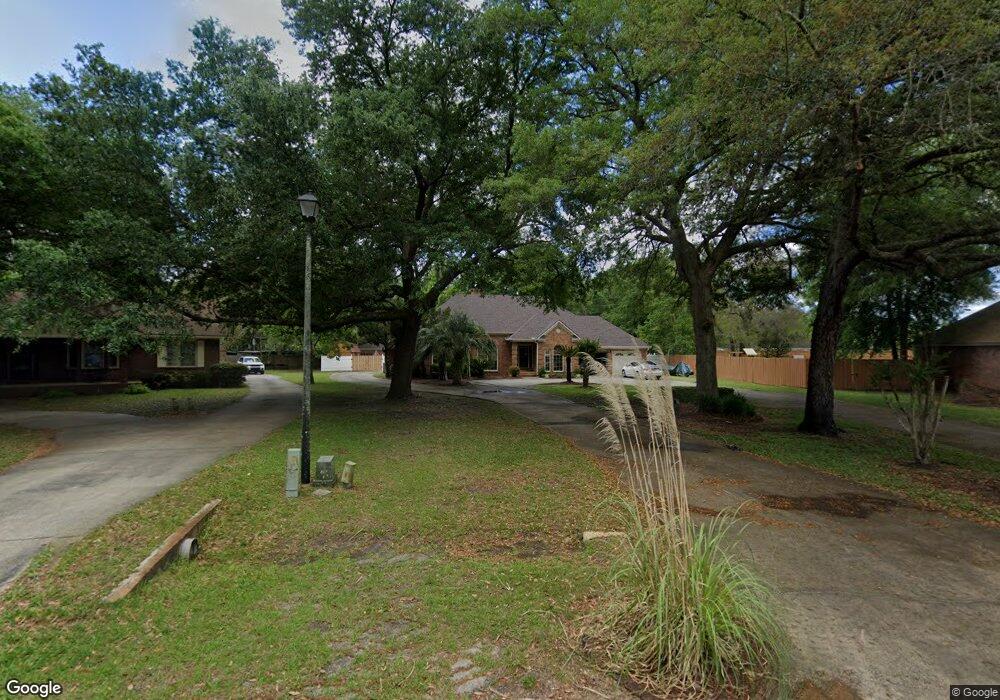
330 Cambridge Cir Unit 15 Kingsland, GA 31548
Estimated Value: $422,000 - $463,000
3
Beds
3
Baths
2,750
Sq Ft
$160/Sq Ft
Est. Value
About This Home
This home is located at 330 Cambridge Cir Unit 15, Kingsland, GA 31548 and is currently estimated at $440,055, approximately $160 per square foot. 330 Cambridge Cir Unit 15 is a home located in Camden County with nearby schools including David L. Rainer Elementary School, Camden Middle School, and Camden County High School.
Ownership History
Date
Name
Owned For
Owner Type
Purchase Details
Closed on
Aug 13, 2020
Sold by
Waycross Bank & Trust
Bought by
Windover Gregory Lewis and Windover Kinsey Leigh
Current Estimated Value
Home Financials for this Owner
Home Financials are based on the most recent Mortgage that was taken out on this home.
Original Mortgage
$285,000
Interest Rate
2.9%
Mortgage Type
New Conventional
Purchase Details
Closed on
Dec 3, 2019
Sold by
Pinto Richard
Bought by
Waycross Bank & Trust
Purchase Details
Closed on
Mar 31, 2014
Sold by
Windover Greg L
Bought by
Pinto Richard and Pinto Maria E
Home Financials for this Owner
Home Financials are based on the most recent Mortgage that was taken out on this home.
Original Mortgage
$268,000
Interest Rate
4.4%
Mortgage Type
New Conventional
Purchase Details
Closed on
Oct 30, 2007
Sold by
Not Provided
Bought by
Windover Greg L
Create a Home Valuation Report for This Property
The Home Valuation Report is an in-depth analysis detailing your home's value as well as a comparison with similar homes in the area
Home Values in the Area
Average Home Value in this Area
Purchase History
| Date | Buyer | Sale Price | Title Company |
|---|---|---|---|
| Windover Gregory Lewis | $225,000 | -- | |
| Waycross Bank & Trust | $239,155 | -- | |
| Pinto Richard | $298,000 | -- | |
| Windover Greg L | -- | -- |
Source: Public Records
Mortgage History
| Date | Status | Borrower | Loan Amount |
|---|---|---|---|
| Closed | Windover Gregory Lewis | $285,000 | |
| Previous Owner | Pinto Richard | $268,000 |
Source: Public Records
Tax History Compared to Growth
Tax History
| Year | Tax Paid | Tax Assessment Tax Assessment Total Assessment is a certain percentage of the fair market value that is determined by local assessors to be the total taxable value of land and additions on the property. | Land | Improvement |
|---|---|---|---|---|
| 2024 | $3,740 | $157,960 | $18,000 | $139,960 |
| 2023 | $3,861 | $156,837 | $12,000 | $144,837 |
| 2022 | $3,879 | $155,491 | $18,000 | $137,491 |
| 2021 | $2,904 | $131,763 | $18,000 | $113,763 |
| 2020 | $3,207 | $112,797 | $18,000 | $94,797 |
| 2019 | $3,098 | $112,797 | $18,000 | $94,797 |
| 2018 | $2,785 | $112,797 | $18,000 | $94,797 |
| 2017 | $2,836 | $105,584 | $18,000 | $87,584 |
| 2016 | $2,836 | $101,410 | $18,000 | $83,410 |
| 2015 | $2,748 | $101,410 | $18,000 | $83,410 |
| 2014 | $2,467 | $96,637 | $18,000 | $78,637 |
Source: Public Records
Map
Nearby Homes
- 281 Cambridge Cir
- 108 Willow Lake Dr
- 130 Bedford Ct
- 118 Ashton Ln
- 234 Waters Edge Dr
- 145 Pine Bluff Blvd W
- 151 Pine Bluff Blvd W
- 0 Shelton Place Unit 1650857
- 123 Pine Bluff Blvd W
- 126 Pine Bluff Terrace
- 138 Holston Cir
- 103 Paradise Ct
- 105 Paradise Ct
- 203 Pine Bluff Dr
- 97 Pine Bluff Blvd E
- 261 Pine Bluff Dr
- 306 Cedar Breeze Dr
- 0 Greentree Rd Unit 17317554
- 109 Pioneer Way
- 1311 E King Ave
- 330 Cambridge Cir
- 340 Cambridge Cir
- 316 Cambridge Cir
- 350 Cambridge Cir
- 290 Cambridge Cir
- 361 Cambridge Cir
- 1728 Scrubby Bluff Rd
- 1700 Scrubby Bluff Rd
- 1746 Scrubby Bluff Rd
- 991 May Creek St
- 991 May Creek Dr
- 372 Cambridge Cir
- 1770 Scrubby Bluff Rd
- 989 May Creek St
- 989 May Creek Dr
- 1676 Scrubby Bluff Rd
- 268 Cambridge Cir
- 391 Cambridge Cir
- 1644 Scrubby Bluff Rd
- 979 May Creek Dr