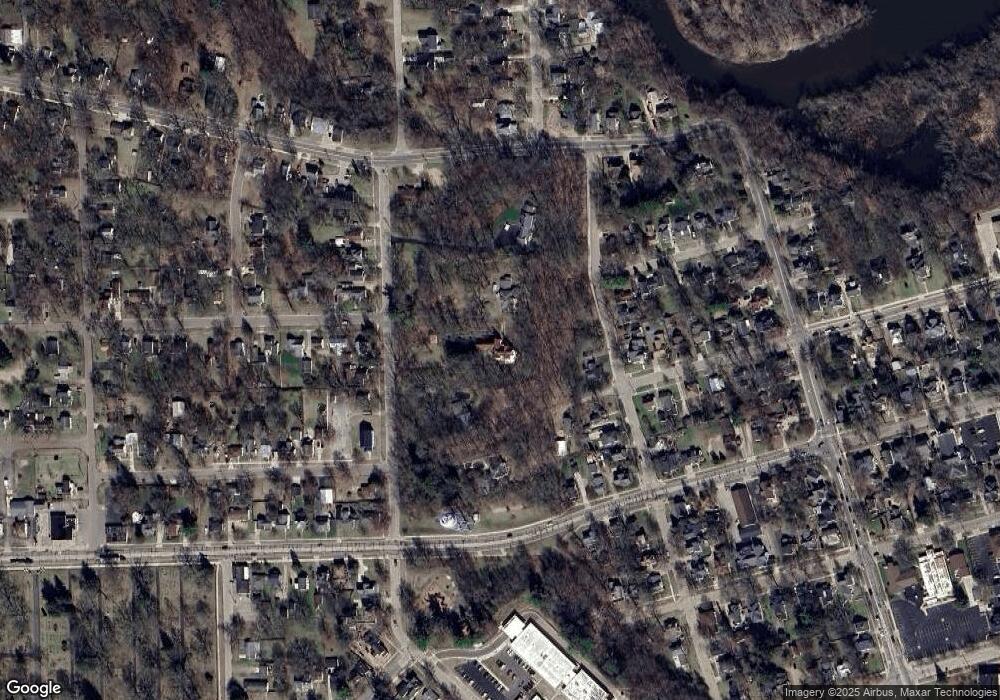
330 Davis St Allegan, MI 49010
Estimated Value: $423,000 - $515,000
5
Beds
3
Baths
4,210
Sq Ft
$113/Sq Ft
Est. Value
About This Home
This home is located at 330 Davis St, Allegan, MI 49010 and is currently estimated at $474,379, approximately $112 per square foot. 330 Davis St is a home located in Allegan County with nearby schools including Dawson Elementary School, L.E. White Middle School, and Allegan High School.
Ownership History
Date
Name
Owned For
Owner Type
Purchase Details
Closed on
Aug 27, 2025
Sold by
Lloyd Diana A and Lloyd Frederick M
Bought by
Lloyd Diana A and Armintrout William Smith
Current Estimated Value
Purchase Details
Closed on
Nov 3, 2008
Sold by
Landamerica Onestop Inc Trust
Bought by
Lloyd Diana A and Lloyd Frederick M
Home Financials for this Owner
Home Financials are based on the most recent Mortgage that was taken out on this home.
Original Mortgage
$168,000
Interest Rate
6.3%
Mortgage Type
Purchase Money Mortgage
Purchase Details
Closed on
Jul 2, 2007
Sold by
Proctor Robert W and Proctor Denebola Rae
Bought by
Landamerica Onestop Inc Trust
Create a Home Valuation Report for This Property
The Home Valuation Report is an in-depth analysis detailing your home's value as well as a comparison with similar homes in the area
Home Values in the Area
Average Home Value in this Area
Purchase History
| Date | Buyer | Sale Price | Title Company |
|---|---|---|---|
| Lloyd Diana A | -- | None Listed On Document | |
| Lloyd Diana A | $210,000 | Law | |
| Landamerica Onestop Inc Trust | $317,500 | None Available |
Source: Public Records
Mortgage History
| Date | Status | Borrower | Loan Amount |
|---|---|---|---|
| Previous Owner | Lloyd Diana A | $168,000 |
Source: Public Records
Tax History
| Year | Tax Paid | Tax Assessment Tax Assessment Total Assessment is a certain percentage of the fair market value that is determined by local assessors to be the total taxable value of land and additions on the property. | Land | Improvement |
|---|---|---|---|---|
| 2025 | $4,229 | $238,600 | $51,800 | $186,800 |
| 2024 | $3,848 | $230,700 | $49,800 | $180,900 |
| 2023 | $3,988 | $193,100 | $46,700 | $146,400 |
| 2022 | $3,848 | $162,200 | $39,400 | $122,800 |
| 2021 | $3,679 | $149,200 | $31,100 | $118,100 |
| 2020 | $3,627 | $122,900 | $25,900 | $97,000 |
| 2019 | $3,537 | $109,900 | $24,700 | $85,200 |
| 2018 | $3,398 | $100,200 | $24,200 | $76,000 |
| 2017 | $0 | $92,200 | $20,200 | $72,000 |
| 2016 | $0 | $75,700 | $16,900 | $58,800 |
| 2015 | -- | $75,700 | $16,900 | $58,800 |
| 2014 | -- | $78,700 | $16,900 | $61,800 |
| 2013 | $7,001 | $82,100 | $16,900 | $65,200 |
Source: Public Records
Map
Nearby Homes
Your Personal Tour Guide
Ask me questions while you tour the home.