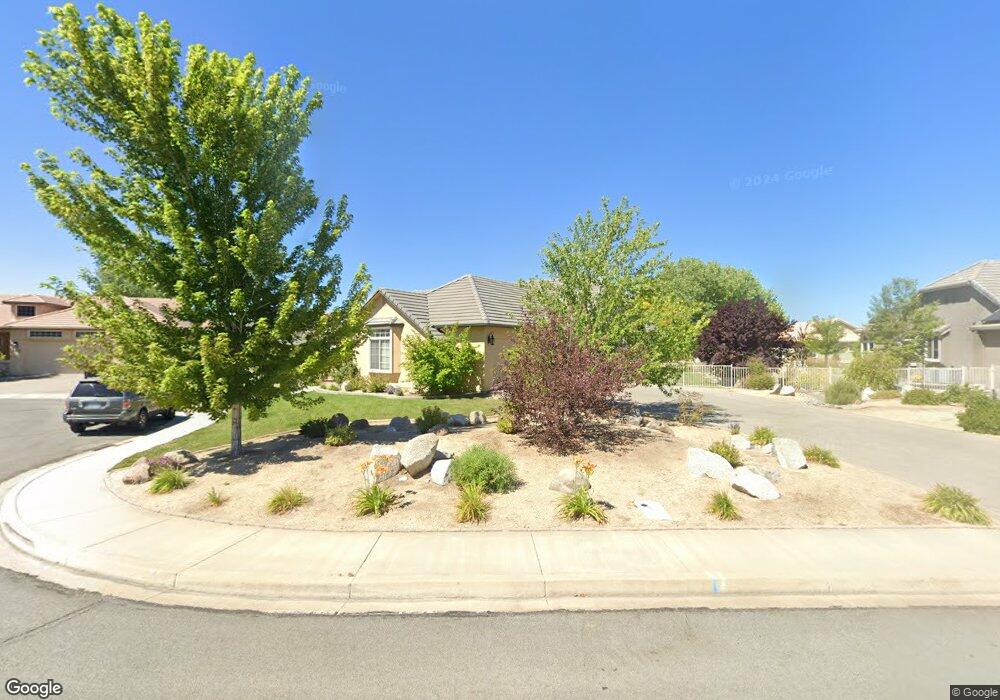
330 Desert Meadow Ct Reno, NV 89502
Hidden Valley NeighborhoodEstimated Value: $899,000 - $1,015,000
3
Beds
3
Baths
2,934
Sq Ft
$320/Sq Ft
Est. Value
About This Home
This home is located at 330 Desert Meadow Ct, Reno, NV 89502 and is currently estimated at $937,656, approximately $319 per square foot. 330 Desert Meadow Ct is a home located in Washoe County with nearby schools including Hidden Valley Elementary School, Edward L Pine Middle School, and Earl Wooster High School.
Ownership History
Date
Name
Owned For
Owner Type
Purchase Details
Closed on
Apr 25, 2017
Sold by
Barbarito Bea A
Bought by
Barbarito Bea A and The Deck Barbarito Living Trust
Current Estimated Value
Purchase Details
Closed on
Sep 10, 2008
Sold by
Zelinski William R
Bought by
Barbarito Bea A
Purchase Details
Closed on
May 7, 2003
Sold by
Zelinski William R and Barbarito Bea A
Bought by
Zelinski William R and Barbarito Bea A
Home Financials for this Owner
Home Financials are based on the most recent Mortgage that was taken out on this home.
Original Mortgage
$322,700
Interest Rate
5.71%
Mortgage Type
Unknown
Purchase Details
Closed on
Sep 17, 1999
Sold by
Hidden Meadows Company
Bought by
Zelinski William R and Barbito Bea A
Home Financials for this Owner
Home Financials are based on the most recent Mortgage that was taken out on this home.
Original Mortgage
$332,800
Interest Rate
7%
Create a Home Valuation Report for This Property
The Home Valuation Report is an in-depth analysis detailing your home's value as well as a comparison with similar homes in the area
Home Values in the Area
Average Home Value in this Area
Purchase History
| Date | Buyer | Sale Price | Title Company |
|---|---|---|---|
| Barbarito Bea A | -- | None Available | |
| Barbarito Bea A | -- | First Centennial Reno | |
| Zelinski William R | -- | Western Title Incorporated | |
| Zelinski William R | $416,500 | First Centennial Title Co |
Source: Public Records
Mortgage History
| Date | Status | Borrower | Loan Amount |
|---|---|---|---|
| Previous Owner | Zelinski William R | $322,700 | |
| Previous Owner | Zelinski William R | $332,800 |
Source: Public Records
Tax History Compared to Growth
Tax History
| Year | Tax Paid | Tax Assessment Tax Assessment Total Assessment is a certain percentage of the fair market value that is determined by local assessors to be the total taxable value of land and additions on the property. | Land | Improvement |
|---|---|---|---|---|
| 2025 | $4,447 | $203,801 | $61,250 | $142,551 |
| 2024 | $4,447 | $201,433 | $57,295 | $144,138 |
| 2023 | $4,319 | $193,396 | $57,295 | $136,101 |
| 2022 | $4,192 | $158,213 | $44,870 | $113,343 |
| 2021 | $4,069 | $149,145 | $36,295 | $112,850 |
| 2020 | $3,950 | $149,628 | $36,295 | $113,333 |
| 2019 | $3,836 | $144,474 | $35,070 | $109,404 |
| 2018 | $3,726 | $131,117 | $24,115 | $107,002 |
| 2017 | $3,617 | $129,507 | $22,190 | $107,317 |
| 2016 | $3,523 | $132,046 | $22,330 | $109,716 |
| 2015 | $3,455 | $126,386 | $20,440 | $105,946 |
| 2014 | $3,354 | $115,971 | $18,620 | $97,351 |
| 2013 | -- | $100,232 | $14,980 | $85,252 |
Source: Public Records
Map
Nearby Homes
- 2100 Parkway Dr
- 2265 Silky Sullivan Ln
- 2285 Silky Sullivan Ln
- 3165 W Hidden Valley Dr
- 3477 E Hidden Valley Dr Unit 3
- 3690 Sleepy Hollow Dr
- 3455 Craviasco Ln
- 2915 Fairwood Dr
- 5409 Greenview Ct
- 5705 Blue Hills Dr
- 5595 Saint Andrews Ct
- 5329 Mira Loma Dr
- 4841 W Hidden Valley Dr
- 3069 Creekwood Dr
- 5279 Mira Loma Dr
- 5675 E Hidden Valley Dr
- 3105 Fairwood Dr
- 5977 Hidden Highlands Dr
- 5979 Hidden Highlands Dr
- 5984 Hidden Highlands Dr
- 320 Desert Meadow Ct
- 310 Desert Meadow Ct Unit 2
- 315 Desert Meadow Ct
- 210 Meadow Edge Ct
- 325 Desert Meadow Ct
- 209 Meadow Edge Ct
- 350 Desert Meadow Ct Unit 2
- 6007 Meadow Edge Dr
- 305 Desert Meadow Ct
- 208 Meadow Edge Ct
- 6009 Meadow Edge Dr
- 345 Desert Meadow Ct Unit 2
- 335 Desert Meadow Ct
- 1840 Hidden Meadows Dr
- 1850 Hidden Meadows Dr
- 6005 Meadow Edge Dr
- 206 Meadow Edge Ct
- 6011 Meadow Edge Dr
- 6003 Meadow Edge Dr
- 1860 Hidden Meadows Dr