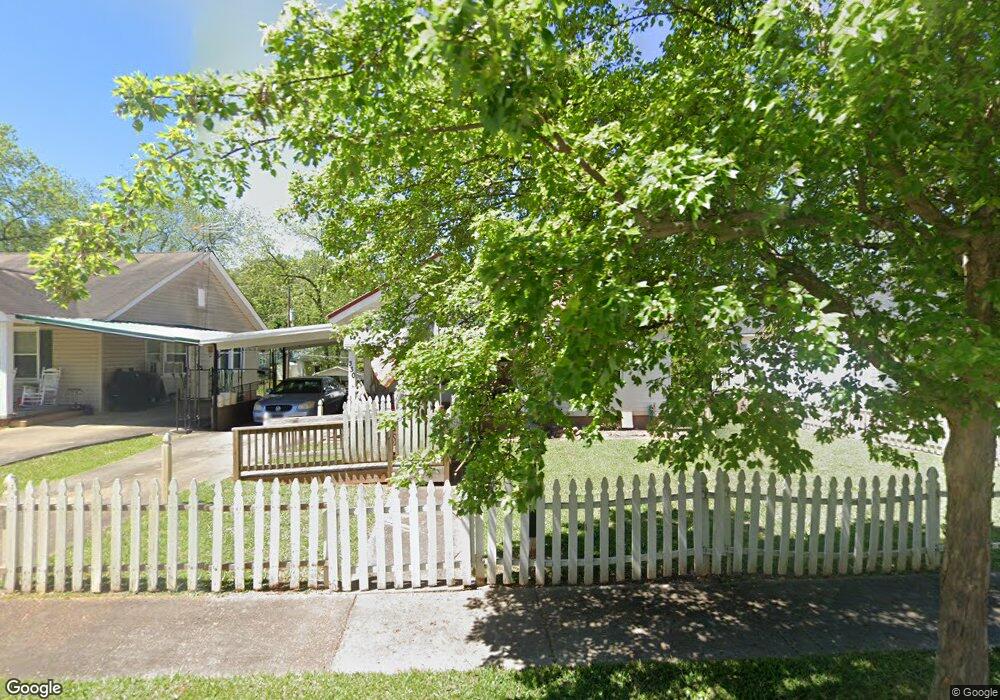
330 E St Thomaston, GA 30286
Estimated Value: $87,000 - $120,000
2
Beds
1
Bath
1,024
Sq Ft
$100/Sq Ft
Est. Value
About This Home
This home is located at 330 E St, Thomaston, GA 30286 and is currently estimated at $102,778, approximately $100 per square foot. 330 E St is a home located in Upson County with nearby schools including Upson-Lee South Elementary School, Upson-Lee North Elementary School, and Upson-Lee Middle School.
Ownership History
Date
Name
Owned For
Owner Type
Purchase Details
Closed on
Aug 7, 2013
Sold by
Mccrary Charlie R
Bought by
Moore Sheila
Current Estimated Value
Home Financials for this Owner
Home Financials are based on the most recent Mortgage that was taken out on this home.
Original Mortgage
$20,000
Outstanding Balance
$14,790
Interest Rate
4.48%
Mortgage Type
New Conventional
Estimated Equity
$87,988
Purchase Details
Closed on
May 15, 2008
Sold by
Sec Of Housing & U
Bought by
Mccrary Charlie R
Purchase Details
Closed on
May 1, 2007
Sold by
Not Provided
Bought by
Mccrary Charlie R
Purchase Details
Closed on
Mar 15, 2006
Sold by
Nunn W Frank
Bought by
Kight Matthew
Home Financials for this Owner
Home Financials are based on the most recent Mortgage that was taken out on this home.
Original Mortgage
$43,696
Interest Rate
6.25%
Mortgage Type
FHA
Create a Home Valuation Report for This Property
The Home Valuation Report is an in-depth analysis detailing your home's value as well as a comparison with similar homes in the area
Purchase History
| Date | Buyer | Sale Price | Title Company |
|---|---|---|---|
| Moore Sheila | $40,000 | -- | |
| Mccrary Charlie R | $20,500 | -- | |
| Mccrary Charlie R | $49,966 | -- | |
| Mccrary Charlie R | $49,966 | -- | |
| Kight Matthew | $44,042 | -- | |
| Mccrary Charlie R | $44,100 | -- |
Source: Public Records
Mortgage History
| Date | Status | Borrower | Loan Amount |
|---|---|---|---|
| Open | Moore Sheila | $20,000 | |
| Previous Owner | Mccrary Charlie R | $43,696 |
Source: Public Records
Tax History
| Year | Tax Paid | Tax Assessment Tax Assessment Total Assessment is a certain percentage of the fair market value that is determined by local assessors to be the total taxable value of land and additions on the property. | Land | Improvement |
|---|---|---|---|---|
| 2025 | $334 | $28,023 | $3,200 | $24,823 |
| 2024 | $334 | $21,968 | $3,200 | $18,768 |
| 2023 | $319 | $22,376 | $3,200 | $19,176 |
| 2022 | $483 | $18,918 | $3,200 | $15,718 |
| 2021 | $476 | $18,216 | $3,200 | $15,016 |
| 2020 | $361 | $13,332 | $3,200 | $10,132 |
| 2019 | $400 | $14,068 | $4,800 | $9,268 |
| 2018 | $400 | $14,068 | $4,800 | $9,268 |
| 2017 | $313 | $10,374 | $1,600 | $8,774 |
| 2016 | $403 | $12,757 | $1,600 | $11,157 |
| 2015 | $430 | $13,615 | $1,600 | $12,015 |
| 2014 | $428 | $13,615 | $1,600 | $12,015 |
Source: Public Records
Map
Nearby Homes
- 0 12th Ave Unit 10630351
- 458 E St
- 119 F St
- 74 E St
- 114 C St NE
- 106 C St NE
- 100 Beaver Run Trace
- 228 R St NW
- 719 9th Ave
- 0 9th Ave Unit 10500756
- 201 4th Ave SE
- 146 O St NW
- 354 S Main St
- 516 W Goodrich Ave
- 115 Hillside Dr
- 119 S St NW
- 0 Goodrich Ave N Unit 10690948
- 108 R St SW
- 600 4th Ave SW
- 03 Multiple Rental Houses
Your Personal Tour Guide
Ask me questions while you tour the home.