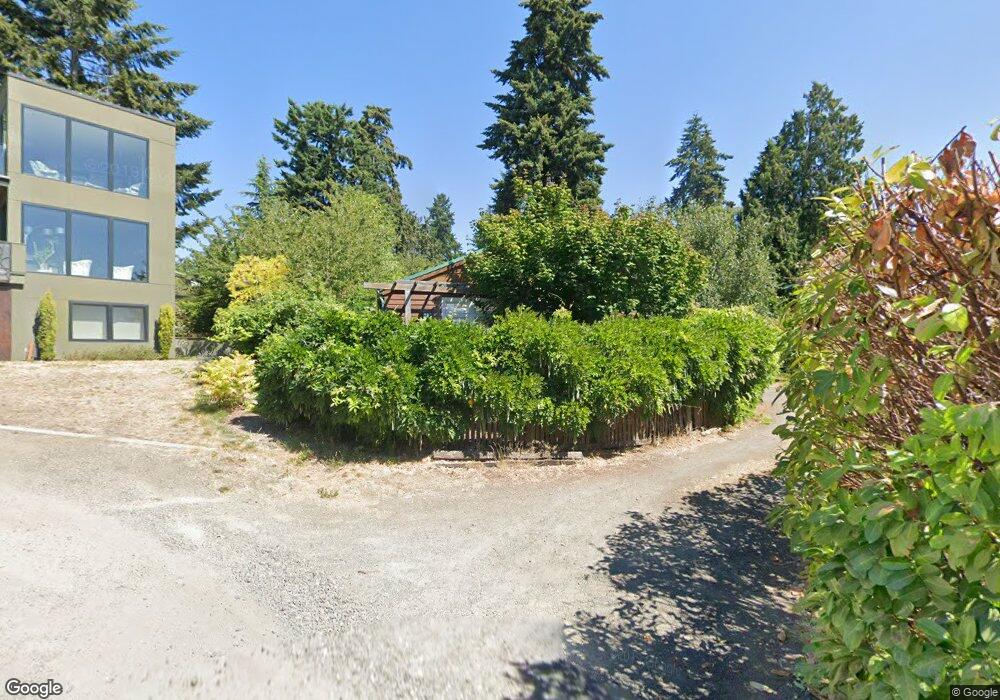
330 Eagle Place NE Bainbridge Island, WA 98110
Estimated Value: $1,348,000 - $1,873,000
3
Beds
2
Baths
2,389
Sq Ft
$671/Sq Ft
Est. Value
About This Home
This home is located at 330 Eagle Place NE, Bainbridge Island, WA 98110 and is currently estimated at $1,603,766, approximately $671 per square foot. 330 Eagle Place NE is a home located in Kitsap County with nearby schools including Bainbridge High School, Madrona School, and St. Cecilia Catholic School.
Ownership History
Date
Name
Owned For
Owner Type
Purchase Details
Closed on
Nov 22, 2000
Sold by
Johannsen Neil and Hilscher Hilary
Bought by
Stephens David L and Green Cheryl L
Current Estimated Value
Home Financials for this Owner
Home Financials are based on the most recent Mortgage that was taken out on this home.
Original Mortgage
$163,000
Outstanding Balance
$59,119
Interest Rate
7.66%
Estimated Equity
$1,544,647
Purchase Details
Closed on
Aug 19, 1999
Sold by
Johannsen Neil C and Hilscher Hilary J
Bought by
Johannsen Neil and Hilscher Hilary
Purchase Details
Closed on
Apr 29, 1998
Sold by
Wood Alvin W and Montgomery Wood Martha L
Bought by
Johannsen Neil C and Hilscher Hilary J
Home Financials for this Owner
Home Financials are based on the most recent Mortgage that was taken out on this home.
Original Mortgage
$100,000
Interest Rate
7.05%
Create a Home Valuation Report for This Property
The Home Valuation Report is an in-depth analysis detailing your home's value as well as a comparison with similar homes in the area
Home Values in the Area
Average Home Value in this Area
Purchase History
| Date | Buyer | Sale Price | Title Company |
|---|---|---|---|
| Stephens David L | $363,000 | Pacific Nw Title | |
| Johannsen Neil | -- | -- | |
| Johannsen Neil C | $210,000 | Pacific Northwest Title |
Source: Public Records
Mortgage History
| Date | Status | Borrower | Loan Amount |
|---|---|---|---|
| Open | Stephens David L | $163,000 | |
| Previous Owner | Johannsen Neil C | $100,000 | |
| Closed | Johannsen Neil C | $89,000 |
Source: Public Records
Tax History Compared to Growth
Tax History
| Year | Tax Paid | Tax Assessment Tax Assessment Total Assessment is a certain percentage of the fair market value that is determined by local assessors to be the total taxable value of land and additions on the property. | Land | Improvement |
|---|---|---|---|---|
| 2026 | $11,082 | $1,375,670 | $660,310 | $715,360 |
| 2025 | $11,082 | $1,374,590 | $660,310 | $714,280 |
| 2024 | $10,530 | $1,367,810 | $660,310 | $707,500 |
| 2023 | $8,579 | $1,061,080 | $660,310 | $400,770 |
| 2022 | $6,184 | $646,480 | $402,050 | $244,430 |
| 2021 | $6,067 | $604,920 | $376,450 | $228,470 |
| 2020 | $5,825 | $572,100 | $355,960 | $216,140 |
| 2019 | $5,353 | $535,270 | $332,910 | $202,360 |
| 2018 | $5,304 | $412,030 | $256,090 | $155,940 |
| 2017 | $4,359 | $412,030 | $256,090 | $155,940 |
| 2016 | $3,635 | $324,910 | $176,610 | $148,300 |
| 2015 | $3,127 | $283,510 | $154,280 | $129,230 |
| 2014 | -- | $267,490 | $154,280 | $113,210 |
| 2013 | -- | $250,480 | $144,130 | $106,350 |
Source: Public Records
Map
Nearby Homes
- 1237 Hawley Way NE
- 744 Hanami Ln NE
- 502 Cave Ave NE
- 965 Winslow Way E Unit 104
- 610 NE Vineyard Ln Unit A104
- 752 NE Vineyard Ln Unit L205
- 511 Groos Ln NE
- 465 Winslow Way E Unit 108
- 428 Harborview Dr SE Unit 112
- 346 Wyatt Way NE Unit 10
- 360 Knechtel Way NE Unit 201
- 1245 High School Rd NE
- 7268 Madrona Dr NE
- 1314 Polly's Ln
- 3 Bedroom Plan at Trillium, Grow Community | Bainbridge Island - The Trillium
- 2 Bedroom Plan at Trillium, Grow Community | Bainbridge Island - The Trillium
- 204 Shepard Way NW
- 224 Canopy Path NW
- 208 Shepard Way NW
- Three Story Townhome Plan at Wintergreen Townhomes - Winter Green Townhomes
- 1100 Donald Place NE
- 1115 Wing Point Way NE
- 340 Eagle Place NE
- 1082 Donald Place NE
- 453 Robinwood Dr NE
- 310 Eagle Place NE
- 311 Eagle Place NE
- 465 Robinwood Dr NE
- 1131 Wing Point Way NE
- 343 Eagle Place NE
- 1151 Donald Place NE
- 360 Eagle Place NE
- 1111 Wing Point Way NE
- 261 Eagle Place NE
- 300 Morrill Place NE
- 447 Robinwood Dr NE
- 475 Robinwood Dr NE
- 1190 Hawley Way NE
- 1127 Wing Point Way NE
- 366 Morrill Place NE