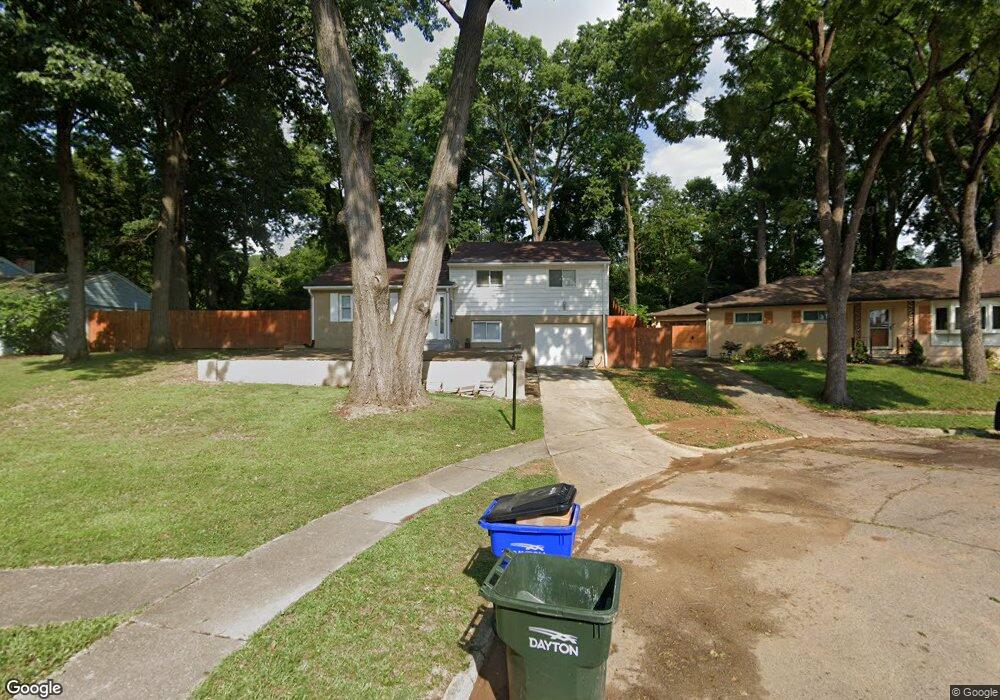
330 Great Oaks Dr Dayton, OH 45403
Wright View NeighborhoodEstimated Value: $99,000 - $142,000
3
Beds
2
Baths
1,462
Sq Ft
$86/Sq Ft
Est. Value
About This Home
This home is located at 330 Great Oaks Dr, Dayton, OH 45403 and is currently estimated at $125,533, approximately $85 per square foot. 330 Great Oaks Dr is a home located in Montgomery County with nearby schools including Ruskin Elementary School, Kiser Elementary, and Horizon Science Academy Dayton Downtown.
Ownership History
Date
Name
Owned For
Owner Type
Purchase Details
Closed on
Mar 6, 2023
Sold by
Salvarov Ildar I and Salvarov Mukhabbat T
Bought by
Salvarov Ilimdar
Current Estimated Value
Home Financials for this Owner
Home Financials are based on the most recent Mortgage that was taken out on this home.
Original Mortgage
$40,400
Outstanding Balance
$39,123
Interest Rate
6.09%
Mortgage Type
New Conventional
Estimated Equity
$86,410
Purchase Details
Closed on
Oct 26, 2022
Sold by
Salvarov Ildar I and Salvarov Mukhabbat T
Bought by
Salvarov Ildar I
Purchase Details
Closed on
Dec 26, 2018
Sold by
Watson David George
Bought by
Salvarov Ildar I and Kubanova Mukhabbat T
Home Financials for this Owner
Home Financials are based on the most recent Mortgage that was taken out on this home.
Original Mortgage
$47,025
Interest Rate
4.8%
Mortgage Type
New Conventional
Create a Home Valuation Report for This Property
The Home Valuation Report is an in-depth analysis detailing your home's value as well as a comparison with similar homes in the area
Home Values in the Area
Average Home Value in this Area
Purchase History
| Date | Buyer | Sale Price | Title Company |
|---|---|---|---|
| Salvarov Ilimdar | $80,000 | None Listed On Document | |
| Salvarov Ildar I | -- | None Listed On Document | |
| Salvarov Ildar I | $49,500 | None Available |
Source: Public Records
Mortgage History
| Date | Status | Borrower | Loan Amount |
|---|---|---|---|
| Open | Salvarov Ilimdar | $40,400 | |
| Previous Owner | Salvarov Ildar I | $47,025 |
Source: Public Records
Tax History Compared to Growth
Tax History
| Year | Tax Paid | Tax Assessment Tax Assessment Total Assessment is a certain percentage of the fair market value that is determined by local assessors to be the total taxable value of land and additions on the property. | Land | Improvement |
|---|---|---|---|---|
| 2024 | $1,382 | $23,850 | $5,580 | $18,270 |
| 2023 | $1,382 | $23,850 | $5,580 | $18,270 |
| 2022 | $1,395 | $19,120 | $4,470 | $14,650 |
| 2021 | $1,387 | $19,120 | $4,470 | $14,650 |
| 2020 | $1,382 | $19,120 | $4,470 | $14,650 |
| 2019 | $1,431 | $17,720 | $5,850 | $11,870 |
| 2018 | $1,433 | $17,720 | $5,850 | $11,870 |
| 2017 | $1,421 | $17,720 | $5,850 | $11,870 |
| 2016 | $1,593 | $18,960 | $6,360 | $12,600 |
| 2015 | $1,507 | $18,960 | $6,360 | $12,600 |
| 2014 | $1,507 | $18,960 | $6,360 | $12,600 |
| 2012 | -- | $22,380 | $8,570 | $13,810 |
Source: Public Records
Map
Nearby Homes
- 515 Heiss Ave Unit 515-517
- 404 S Smithville Rd
- 520 S Smithville Rd
- 1323 Huffman Ave
- 1626 Darst Ave
- 1614 Huffman Ave Unit 1612
- 1629 Suman Ave
- 715 Gondert Ave
- 101 S Delmar Ave
- 223 Pleasant Ave
- 631 Greenlawn Ave
- 1730 Darst Ave
- 1700 Suman Ave
- 420 Dawnview Ave
- 1620 Gondert Ave Unit 1618
- 1620 Gondert Ave
- 153 S Hedges St
- 4856 Airway Rd
- 161 S Harbine Ave
- 4129 E 3rd St Unit 4127
- 320 Great Oaks Dr
- 340 Great Oaks Dr
- 312 Great Oaks Dr
- 346 Great Oaks Dr
- 331 Great Oaks Dr
- 304 Great Oaks Dr
- 345 Great Oaks Dr
- 323 Great Oaks Dr
- 339 Great Oaks Dr
- 317 Great Oaks Dr
- 1461 Darst Ave
- 1465 Darst Ave
- 1469 Darst Ave
- 1457 Darst Ave
- 1449 Darst Ave
- 1445 Darst Ave
- 1439 Darst Ave
- 720 Burkhardt Ave
- 720 Burkhardt Ave
- 1435 Darst Ave