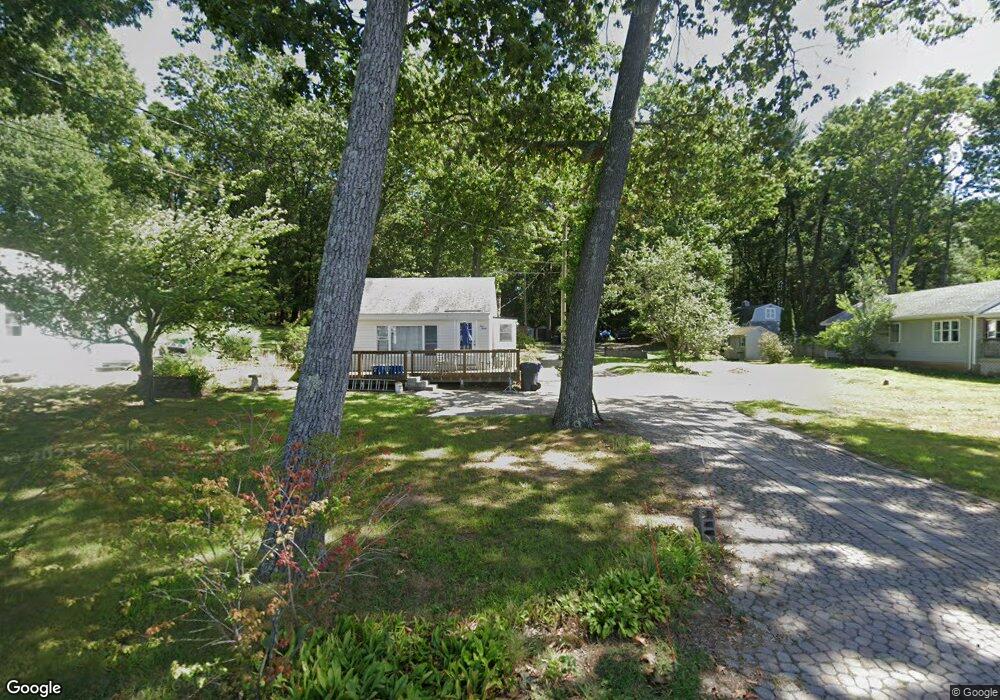
330 Halladay Dr West Suffield, CT 06093
Estimated Value: $215,000 - $327,000
1
Bed
1
Bath
754
Sq Ft
$341/Sq Ft
Est. Value
About This Home
This home is located at 330 Halladay Dr, West Suffield, CT 06093 and is currently estimated at $257,018, approximately $340 per square foot. 330 Halladay Dr is a home located in Hartford County with nearby schools including A. Ward Spaulding School, Mcalister Intermediate School, and Suffield Middle School.
Ownership History
Date
Name
Owned For
Owner Type
Purchase Details
Closed on
Mar 26, 1999
Sold by
Hedberg Barbara
Bought by
Mather Kenneth
Current Estimated Value
Home Financials for this Owner
Home Financials are based on the most recent Mortgage that was taken out on this home.
Original Mortgage
$72,000
Interest Rate
7.03%
Purchase Details
Closed on
Jan 24, 1992
Sold by
Lewis John
Bought by
Mather Kenneth
Home Financials for this Owner
Home Financials are based on the most recent Mortgage that was taken out on this home.
Original Mortgage
$81,350
Interest Rate
8.45%
Create a Home Valuation Report for This Property
The Home Valuation Report is an in-depth analysis detailing your home's value as well as a comparison with similar homes in the area
Home Values in the Area
Average Home Value in this Area
Purchase History
| Date | Buyer | Sale Price | Title Company |
|---|---|---|---|
| Mather Kenneth | $18,000 | -- | |
| Mather Kenneth | $82,000 | -- |
Source: Public Records
Mortgage History
| Date | Status | Borrower | Loan Amount |
|---|---|---|---|
| Open | Mather Kenneth | $65,000 | |
| Closed | Mather Kenneth | $72,000 | |
| Previous Owner | Mather Kenneth | $81,350 |
Source: Public Records
Tax History
| Year | Tax Paid | Tax Assessment Tax Assessment Total Assessment is a certain percentage of the fair market value that is determined by local assessors to be the total taxable value of land and additions on the property. | Land | Improvement |
|---|---|---|---|---|
| 2025 | $3,187 | $136,150 | $52,570 | $83,580 |
| 2024 | $3,081 | $136,150 | $52,570 | $83,580 |
| 2023 | $2,678 | $93,590 | $52,850 | $40,740 |
| 2022 | $2,678 | $93,590 | $52,850 | $40,740 |
| 2021 | $2,680 | $93,590 | $52,850 | $40,740 |
| 2020 | $2,680 | $93,590 | $52,850 | $40,740 |
| 2019 | $2,688 | $93,590 | $52,850 | $40,740 |
| 2018 | $2,858 | $97,490 | $53,530 | $43,960 |
| 2017 | $2,816 | $97,490 | $53,530 | $43,960 |
| 2016 | $2,749 | $97,490 | $53,530 | $43,960 |
| 2015 | $2,708 | $97,490 | $53,530 | $43,960 |
| 2014 | $2,644 | $97,490 | $53,530 | $43,960 |
Source: Public Records
Map
Nearby Homes
- 3 Evergreen St
- 4066 Mountain Rd
- 40 Berkshire Ave
- 141 Point Grove Rd
- 10 Ridgewood Dr
- 32 Sheep Pasture Rd
- 187 Griffin Rd
- 80 Bungalow St
- 245 Birch Rd
- 2 Stratton Farms Rd
- 150 S Longyard Rd
- 7 Rising Corner Rd
- 62 Southview Dr Unit 62
- 61 S View Dr
- 31 Pineywood Rd
- 21 Fred Jackson Rd
- 8 Curtis Rd
- 15 Stoneybrook Dr
- 17 Stoneybrook Dr
- 233 Mort Vining Rd
Your Personal Tour Guide
Ask me questions while you tour the home.