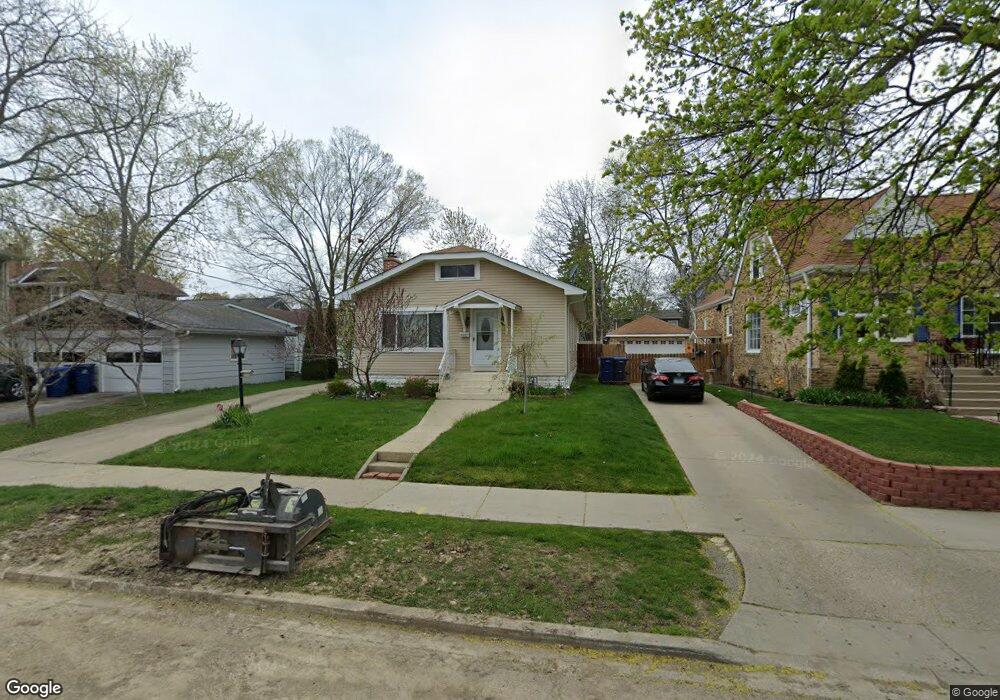
330 Judge Ave Waukegan, IL 60085
West Waukegan NeighborhoodEstimated Value: $226,000 - $258,000
3
Beds
1
Bath
1,377
Sq Ft
$177/Sq Ft
Est. Value
About This Home
This home is located at 330 Judge Ave, Waukegan, IL 60085 and is currently estimated at $244,387, approximately $177 per square foot. 330 Judge Ave is a home located in Lake County with nearby schools including Hyde Park Elementary School, Miguel Juarez Middle School, and Waukegan High School.
Ownership History
Date
Name
Owned For
Owner Type
Purchase Details
Closed on
Oct 30, 2003
Sold by
Carrillo Daniel and Carrillo Maria L
Bought by
Carrillo Maria L
Current Estimated Value
Purchase Details
Closed on
Aug 22, 1996
Sold by
Storey Linda S
Bought by
Carrillo Daniel and Carrillo Maria L
Home Financials for this Owner
Home Financials are based on the most recent Mortgage that was taken out on this home.
Original Mortgage
$70,000
Outstanding Balance
$5,578
Interest Rate
8.3%
Estimated Equity
$238,809
Purchase Details
Closed on
Aug 24, 1995
Sold by
Storey Linda
Bought by
Storey Linda S
Purchase Details
Closed on
Jan 17, 1994
Sold by
Storey Arlene
Bought by
Storey Linda
Home Financials for this Owner
Home Financials are based on the most recent Mortgage that was taken out on this home.
Original Mortgage
$40,000
Interest Rate
7.22%
Mortgage Type
Seller Take Back
Create a Home Valuation Report for This Property
The Home Valuation Report is an in-depth analysis detailing your home's value as well as a comparison with similar homes in the area
Home Values in the Area
Average Home Value in this Area
Purchase History
| Date | Buyer | Sale Price | Title Company |
|---|---|---|---|
| Carrillo Maria L | -- | -- | |
| Carrillo Daniel | $90,000 | -- | |
| Storey Linda S | -- | -- | |
| Storey Linda | -- | -- | |
| Storey Linda | -- | -- |
Source: Public Records
Mortgage History
| Date | Status | Borrower | Loan Amount |
|---|---|---|---|
| Open | Carrillo Daniel | $70,000 | |
| Previous Owner | Storey Linda | $40,000 |
Source: Public Records
Tax History Compared to Growth
Tax History
| Year | Tax Paid | Tax Assessment Tax Assessment Total Assessment is a certain percentage of the fair market value that is determined by local assessors to be the total taxable value of land and additions on the property. | Land | Improvement |
|---|---|---|---|---|
| 2024 | $4,426 | $61,362 | $9,567 | $51,795 |
| 2023 | $4,095 | $54,937 | $8,565 | $46,372 |
| 2022 | $4,095 | $47,890 | $7,807 | $40,083 |
| 2021 | $3,730 | $41,775 | $7,354 | $34,421 |
| 2020 | $3,731 | $38,918 | $6,851 | $32,067 |
| 2019 | $3,703 | $35,662 | $6,278 | $29,384 |
| 2018 | $3,103 | $29,377 | $7,406 | $21,971 |
| 2017 | $2,844 | $25,990 | $6,552 | $19,438 |
| 2016 | $2,563 | $22,584 | $5,693 | $16,891 |
| 2015 | $2,401 | $20,213 | $5,095 | $15,118 |
| 2014 | $3,249 | $25,188 | $5,431 | $19,757 |
| 2012 | $3,284 | $27,289 | $5,884 | $21,405 |
Source: Public Records
Map
Nearby Homes
- 1416 Hamilton Ct
- 2115 Lydia St
- 1213 Grand Ave
- 23 N Jackson St
- 824 N Butrick St
- 615 Tiffany Dr
- 49 S Lewis Ave
- 1521 Catalpa Ave
- 511 Chestnut St
- 1109 Massena Ave
- 428 N Poplar St
- 522 N Poplar St
- 968 Judge Ave
- 702 Franklin St
- 620 N Poplar St
- 28 N Saint James St
- 917 N Linden Ave
- 1000 Pine St
- 0 Brookside Ave
- 1005 N Lewis Ave
- 336 Judge Ave
- 1606 Brookside Ave
- 1602 Brookside Ave
- 338 Judge Ave
- 1610 Brookside Ave
- 331 Lorraine Ave
- 335 Lorraine Ave
- 1614 Brookside Ave
- 340 Judge Ave
- 327 Judge Ave
- 1618 Brookside Ave
- 331 Judge Ave
- 335 Judge Ave
- 401 Lorraine Ave
- 406 Judge Ave
- 1534 Brookside Ave
- 337 Judge Ave
- 405 Lorraine Ave
- 401 Judge Ave
- 1530 Brookside Ave