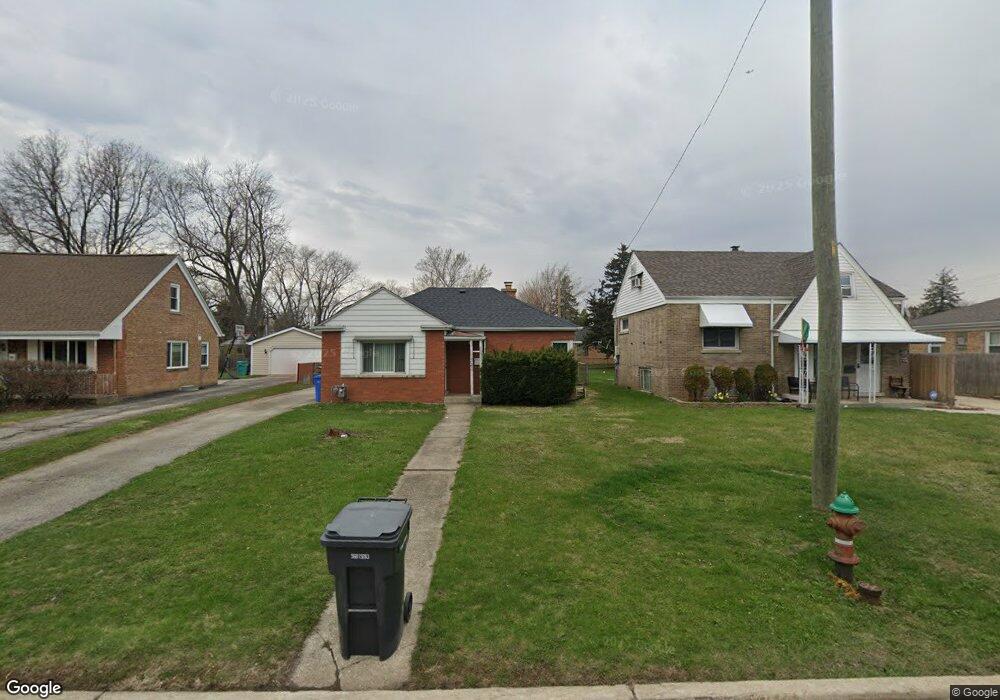
330 Maple Ln Hillside, IL 60162
Estimated Value: $249,729 - $304,000
2
Beds
1
Bath
783
Sq Ft
$343/Sq Ft
Est. Value
About This Home
This home is located at 330 Maple Ln, Hillside, IL 60162 and is currently estimated at $268,432, approximately $342 per square foot. 330 Maple Ln is a home located in Cook County with nearby schools including Hillside Elementary School, Proviso West High School, and Meca Elementary School.
Ownership History
Date
Name
Owned For
Owner Type
Purchase Details
Closed on
Mar 8, 2018
Sold by
Favela Fernando
Bought by
Favela Loretta and Almaguer Loretta
Current Estimated Value
Purchase Details
Closed on
Jun 29, 1999
Sold by
Zygler Leo R and Zygler Patricia M
Bought by
Favela Fernando and Almaguer Loretta
Home Financials for this Owner
Home Financials are based on the most recent Mortgage that was taken out on this home.
Original Mortgage
$107,311
Outstanding Balance
$27,173
Interest Rate
7.29%
Mortgage Type
FHA
Estimated Equity
$241,259
Purchase Details
Closed on
Feb 26, 1996
Sold by
Martin John V and Cranston Augusta Gussie W
Bought by
Zygler Leo R and Zygler Patricia M
Home Financials for this Owner
Home Financials are based on the most recent Mortgage that was taken out on this home.
Original Mortgage
$85,500
Interest Rate
7.05%
Create a Home Valuation Report for This Property
The Home Valuation Report is an in-depth analysis detailing your home's value as well as a comparison with similar homes in the area
Home Values in the Area
Average Home Value in this Area
Purchase History
| Date | Buyer | Sale Price | Title Company |
|---|---|---|---|
| Favela Loretta | -- | None Available | |
| Favela Fernando | $107,500 | -- | |
| Zygler Leo R | $90,000 | Ticor Title Insurance |
Source: Public Records
Mortgage History
| Date | Status | Borrower | Loan Amount |
|---|---|---|---|
| Open | Favela Fernando | $107,311 | |
| Previous Owner | Zygler Leo R | $85,500 |
Source: Public Records
Tax History
| Year | Tax Paid | Tax Assessment Tax Assessment Total Assessment is a certain percentage of the fair market value that is determined by local assessors to be the total taxable value of land and additions on the property. | Land | Improvement |
|---|---|---|---|---|
| 2025 | $5,456 | $18,546 | $3,652 | $14,894 |
| 2024 | $5,550 | $18,546 | $3,652 | $14,894 |
| 2023 | $5,550 | $18,546 | $3,652 | $14,894 |
| 2022 | $5,550 | $17,490 | $3,154 | $14,336 |
| 2021 | $5,467 | $17,488 | $3,153 | $14,335 |
| 2020 | $5,398 | $17,488 | $3,153 | $14,335 |
| 2019 | $3,655 | $12,544 | $2,821 | $9,723 |
| 2018 | $3,549 | $12,544 | $2,821 | $9,723 |
| 2017 | $3,433 | $12,544 | $2,821 | $9,723 |
| 2016 | $3,098 | $10,597 | $2,489 | $8,108 |
| 2015 | $2,951 | $10,597 | $2,489 | $8,108 |
| 2014 | $2,896 | $10,597 | $2,489 | $8,108 |
| 2013 | $3,344 | $12,768 | $2,489 | $10,279 |
Source: Public Records
Map
Nearby Homes
- 311 Buckthorn Ln
- 326 N Forest Ave
- 4353 Butterfield Rd
- 500 N Laverne Ave
- 605 N Wolf Rd Unit B9
- 512 50th Ave
- 540 47th Ave
- 70 N Laverne Ave
- 226 N Lind Ave
- 768 N Rohde Ave
- 250 N Irving Ave
- 504 N Irving Ave
- 429 Geneva Ave
- 443 Granville Ave
- 4904 W Hawthorne Ave
- 4938 W Randolph St
- 4929 W Randolph St
- 241 48th Ave
- 1426 N Rohde Ave
- 3912 Adams St
Your Personal Tour Guide
Ask me questions while you tour the home.