Estimated Value: $363,000 - $408,000
4
Beds
3
Baths
2,043
Sq Ft
$192/Sq Ft
Est. Value
About This Home
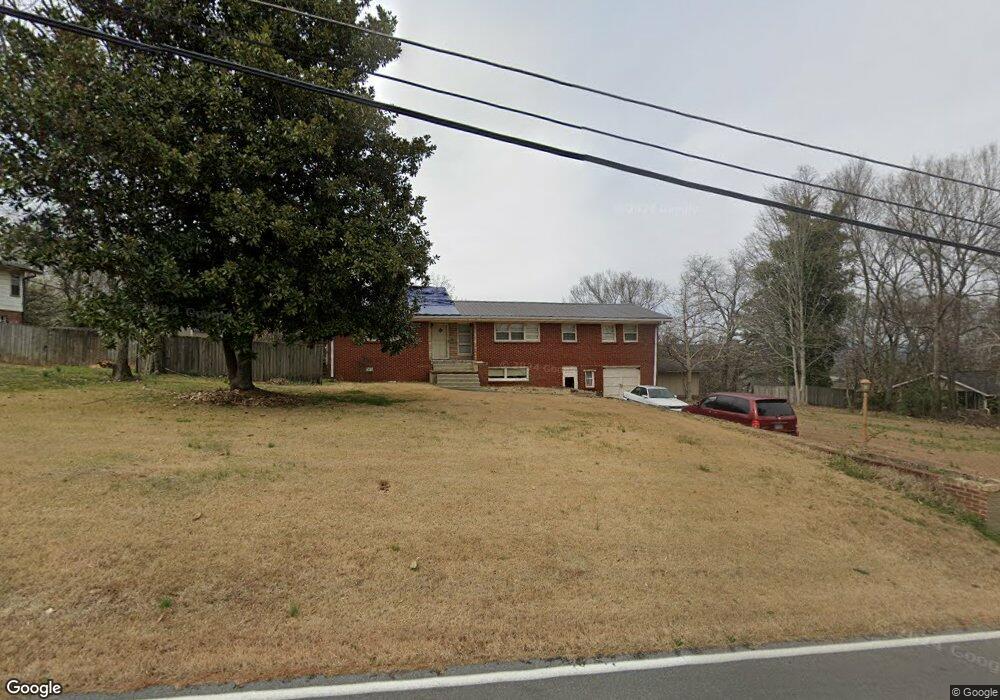
This home is located at 330 Mount Alto Rd SW, Rome, GA 30165 and is currently estimated at $391,749, approximately $191 per square foot. 330 Mount Alto Rd SW is a home located in Floyd County with nearby schools including Coosa Middle School, Coosa High School, and Darlington School.
Ownership History
Date
Name
Owned For
Owner Type
Purchase Details
Closed on
May 15, 2017
Sold by
Brownlow Gordon Brent
Bought by
Cox Emily A
Current Estimated Value
Home Financials for this Owner
Home Financials are based on the most recent Mortgage that was taken out on this home.
Original Mortgage
$153,174
Outstanding Balance
$125,231
Interest Rate
3.5%
Mortgage Type
FHA
Estimated Equity
$266,518
Purchase Details
Closed on
Dec 17, 1999
Sold by
White
Bought by
Brownlow Gordon Brent and Lisa Gail B
Purchase Details
Closed on
Jul 8, 1983
Sold by
Greear Phillip F C
Bought by
Greear Phillip F C and Greear Mildred
Purchase Details
Closed on
May 1, 1967
Sold by
Master Mortgage Corporation
Bought by
Greear Phillip F C
Purchase Details
Closed on
Sep 6, 1966
Sold by
Moore Liselotte H
Bought by
Master Mortgage Corporation
Purchase Details
Closed on
Jan 2, 1901
Sold by
Griggers Liselotte H
Bought by
Moore Liselotte H
Purchase Details
Closed on
Jan 1, 1901
Bought by
Griggers Liselotte H
Create a Home Valuation Report for This Property
The Home Valuation Report is an in-depth analysis detailing your home's value as well as a comparison with similar homes in the area
Home Values in the Area
Average Home Value in this Area
Purchase History
| Date | Buyer | Sale Price | Title Company |
|---|---|---|---|
| Cox Emily A | $156,000 | -- | |
| Brownlow Gordon Brent | $125,000 | -- | |
| Greear Phillip F C | -- | -- | |
| White | -- | -- | |
| Greear Phillip F C | $22,100 | -- | |
| Master Mortgage Corporation | $7,700 | -- | |
| Moore Liselotte H | -- | -- | |
| Griggers Liselotte H | -- | -- |
Source: Public Records
Mortgage History
| Date | Status | Borrower | Loan Amount |
|---|---|---|---|
| Open | Cox Emily A | $153,174 |
Source: Public Records
Tax History Compared to Growth
Tax History
| Year | Tax Paid | Tax Assessment Tax Assessment Total Assessment is a certain percentage of the fair market value that is determined by local assessors to be the total taxable value of land and additions on the property. | Land | Improvement |
|---|---|---|---|---|
| 2024 | $2,992 | $125,029 | $17,172 | $107,857 |
| 2023 | $2,995 | $118,547 | $15,264 | $103,283 |
| 2022 | $2,637 | $98,521 | $12,720 | $85,801 |
| 2021 | $2,479 | $88,312 | $12,720 | $75,592 |
| 2020 | $2,361 | $80,781 | $9,540 | $71,241 |
| 2019 | $2,138 | $71,183 | $9,540 | $61,643 |
| 2018 | $1,877 | $69,159 | $9,540 | $59,619 |
| 2017 | $1,737 | $64,853 | $9,540 | $55,313 |
| 2016 | $1,731 | $63,357 | $9,520 | $53,837 |
| 2015 | $1,699 | $63,357 | $9,520 | $53,837 |
| 2014 | $1,699 | $63,357 | $9,520 | $53,837 |
Source: Public Records
Map
Nearby Homes
- 27 Bluff Mountain Dr SW
- 20 Pine Valley Rd SW
- 4 Wayne St SW
- 2 Wayne St SW
- 17 Wilkerson Rd SW
- 28 Crestwood Dr SW
- 202 Green View Rd SW
- 16 Wilkerson Rd SW
- 13 Ridgewood Rd SW
- 0 Featherston Rd SW Unit 10512723
- 0 Featherston Rd SW Unit 13890394
- 0 Mount Alto Rd SW Unit 10523740
- 14 Berckman Ln SW
- 5 Andrea Ct SW
- 19 Berckman Ln SW
- 3 Berckman Ln SW
- 50 Melton Ave SW
- 438 Wilkerson Rd SW
- 506 Wilkerson Rd SW
- 3 Pebble Bend Ct
- 330 Mt Alto Rd
- 328 Mount Alto Rd SW
- 332 Mount Alto Rd SW
- 326 Mount Alto Rd SW
- 329 Mount Alto Rd SW
- 331 Mt Alto Rd SW
- 334 Mount Alto Rd SW Unit 23/25
- 334 Mount Alto Rd SW
- 333 Mount Alto Rd SW
- 56 Mountain Crest Dr SW
- 327 Mount Alto Rd SW
- 324 Mount Alto Rd SW
- 336 Mount Alto Rd SW
- 335 Mount Alto Rd SW
- 325 Mount Alto Rd SW
- 55 Mountain Crest Dr SW Unit 29
- 55 Mountain Crest Dr SW
- 52 Moutain Crest Dr
- 52 Mountain Crest Dr SW
- 52 Mountain Crest Dr SW Unit 2