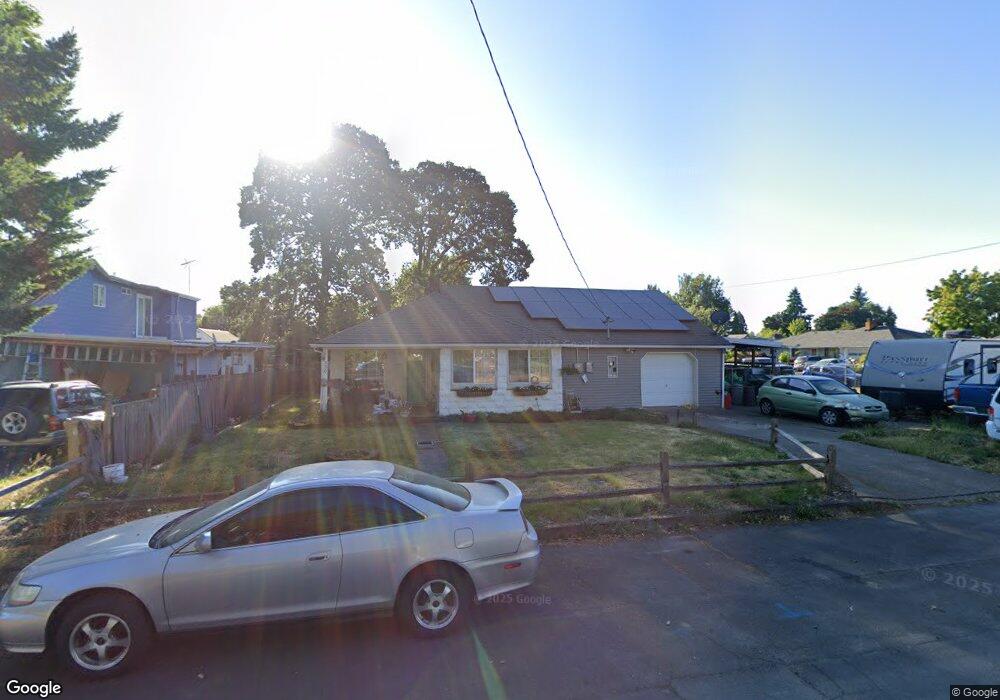
330 N 16th Ave Cornelius, OR 97113
Estimated Value: $391,000 - $451,346
3
Beds
2
Baths
1,686
Sq Ft
$252/Sq Ft
Est. Value
About This Home
This home is located at 330 N 16th Ave, Cornelius, OR 97113 and is currently estimated at $425,587, approximately $252 per square foot. 330 N 16th Ave is a home located in Washington County with nearby schools including Cornelius Elementary School, Neil Armstrong Middle School, and Tom McCall Upper Elementary School.
Ownership History
Date
Name
Owned For
Owner Type
Purchase Details
Closed on
Aug 20, 2019
Sold by
Clute Melissa M
Bought by
Clute Eamer J
Current Estimated Value
Home Financials for this Owner
Home Financials are based on the most recent Mortgage that was taken out on this home.
Original Mortgage
$277,624
Outstanding Balance
$242,872
Interest Rate
3.75%
Mortgage Type
FHA
Estimated Equity
$182,715
Purchase Details
Closed on
May 25, 2004
Sold by
Done Brian W and Done Deborah A
Bought by
Clute Eamer J and Clute Melissa M
Home Financials for this Owner
Home Financials are based on the most recent Mortgage that was taken out on this home.
Original Mortgage
$138,400
Interest Rate
5.75%
Mortgage Type
Unknown
Create a Home Valuation Report for This Property
The Home Valuation Report is an in-depth analysis detailing your home's value as well as a comparison with similar homes in the area
Purchase History
| Date | Buyer | Sale Price | Title Company |
|---|---|---|---|
| Clute Eamer J | -- | First American Title | |
| Clute Eamer J | $173,000 | Transnation Title Agency Or |
Source: Public Records
Mortgage History
| Date | Status | Borrower | Loan Amount |
|---|---|---|---|
| Open | Clute Eamer J | $277,624 | |
| Closed | Clute Eamer J | $138,400 | |
| Closed | Clute Eamer J | $34,600 |
Source: Public Records
Tax History
| Year | Tax Paid | Tax Assessment Tax Assessment Total Assessment is a certain percentage of the fair market value that is determined by local assessors to be the total taxable value of land and additions on the property. | Land | Improvement |
|---|---|---|---|---|
| 2026 | $3,283 | $188,960 | -- | -- |
| 2025 | $3,283 | $183,460 | -- | -- |
| 2024 | $2,998 | $178,120 | -- | -- |
| 2023 | $2,998 | $172,940 | $0 | $0 |
| 2022 | $2,657 | $172,940 | $0 | $0 |
| 2021 | $2,625 | $163,020 | $0 | $0 |
| 2020 | $2,615 | $158,280 | $0 | $0 |
| 2019 | $2,558 | $153,670 | $0 | $0 |
| 2018 | $2,479 | $149,200 | $0 | $0 |
| 2017 | $2,403 | $144,860 | $0 | $0 |
| 2016 | $2,335 | $140,650 | $0 | $0 |
| 2015 | $2,197 | $136,560 | $0 | $0 |
| 2014 | $2,122 | $132,590 | $0 | $0 |
Source: Public Records
Map
Nearby Homes
- 328 N 15th Ave
- 333 N 19th Ave
- 507 N 19th Ave Unit 99
- 507 N 19th Ave Unit 18
- 507 N 19th Ave Unit 1
- 507 N 19th Ave Unit 49
- 507 N 19th Ave Unit 7
- 570 N 10th St Unit 29
- 570 N 10th Ave Unit 2
- 570 N 10th Ave Unit 6
- 570 N 10th Ave Unit 110
- 861 N 19th Ave
- 764 N 20th Place
- 1701 S Alpine St
- 43 S 20th Ave
- 122 S 12th Ave
- 302 S 19th Ave
- 369 S 16th Ave
- 2329 N Gray St
- 2224 N Irvine St
- 354 N 16th Ave
- 335 N 17th Ave
- 370 N 16th Ave
- 331 N 16th Ave
- 1661 N Clark St
- 1601 N Clark St
- 353 N 16th Ave
- 1697 N Davis St
- 279 N 17th Ave
- 1579 N Davis St
- 1569 N Davis St
- 1686 N Barlow St
- 1670 N Davis St
- 1660 N Barlow St
- 324 N 17th Ave
- 267 N 17th Ave
- 358 N 15th Ave
- 1723 N Davis St
- 1638 N Davis St
- 282 N 17th Ave
Your Personal Tour Guide
Ask me questions while you tour the home.