Estimated Value: $311,000 - $397,000
3
Beds
2
Baths
1,872
Sq Ft
$184/Sq Ft
Est. Value
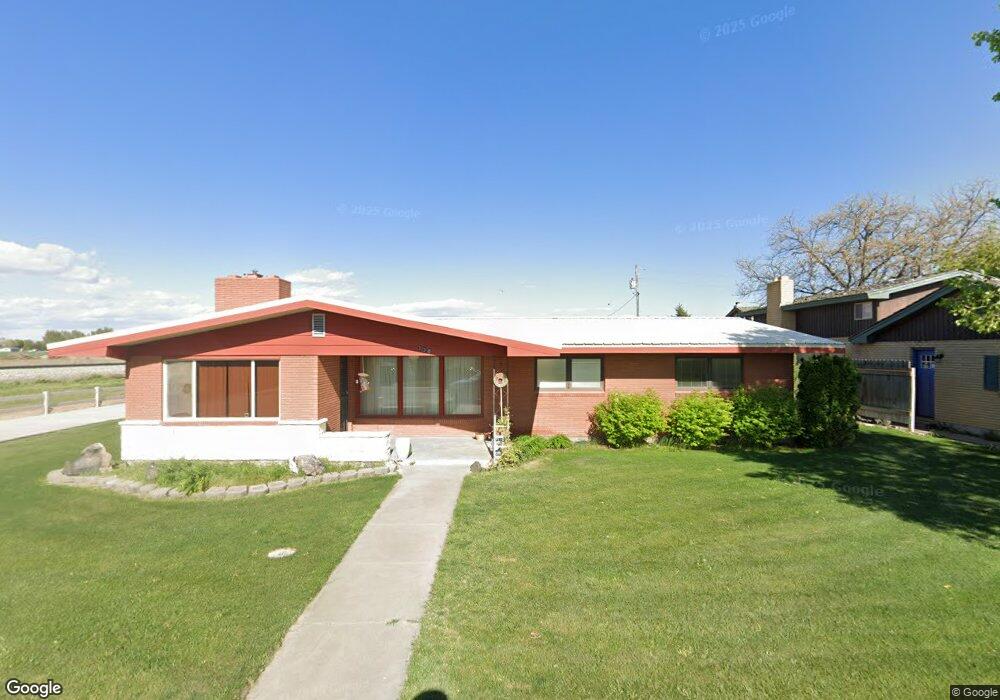
About This Home
This home is located at 330 N 4th St W, Paul, ID 83347 and is currently estimated at $344,411, approximately $183 per square foot. 330 N 4th St W is a home with nearby schools including Paul Elementary School, Minico Senior High School, and Artec Charter School.
Ownership History
Date
Name
Owned For
Owner Type
Purchase Details
Closed on
Jan 27, 2020
Sold by
Schneider Angela
Bought by
Schneider Kim
Current Estimated Value
Home Financials for this Owner
Home Financials are based on the most recent Mortgage that was taken out on this home.
Original Mortgage
$64,500
Outstanding Balance
$39,325
Interest Rate
3.7%
Mortgage Type
New Conventional
Estimated Equity
$305,086
Purchase Details
Closed on
Jul 10, 2019
Sold by
Schneider Kim and Schneider Angela M
Bought by
Schneider Kim
Home Financials for this Owner
Home Financials are based on the most recent Mortgage that was taken out on this home.
Original Mortgage
$65,000
Interest Rate
4.1%
Mortgage Type
New Conventional
Purchase Details
Closed on
May 17, 2019
Sold by
Suhr Colleen Sheila and Estate Of Ronald W Bothum
Bought by
Schneider Kim and Schneider Angela M
Home Financials for this Owner
Home Financials are based on the most recent Mortgage that was taken out on this home.
Original Mortgage
$65,000
Interest Rate
4.1%
Mortgage Type
New Conventional
Create a Home Valuation Report for This Property
The Home Valuation Report is an in-depth analysis detailing your home's value as well as a comparison with similar homes in the area
Home Values in the Area
Average Home Value in this Area
Purchase History
| Date | Buyer | Sale Price | Title Company |
|---|---|---|---|
| Schneider Kim | -- | Titleone Twin Falls | |
| Schneider Kim | -- | None Available | |
| Schneider Kim | -- | Titleone Twin Falls |
Source: Public Records
Mortgage History
| Date | Status | Borrower | Loan Amount |
|---|---|---|---|
| Open | Schneider Kim | $64,500 | |
| Closed | Schneider Kim | $65,000 |
Source: Public Records
Tax History Compared to Growth
Tax History
| Year | Tax Paid | Tax Assessment Tax Assessment Total Assessment is a certain percentage of the fair market value that is determined by local assessors to be the total taxable value of land and additions on the property. | Land | Improvement |
|---|---|---|---|---|
| 2024 | $1,692 | $323,336 | $21,416 | $301,920 |
| 2023 | $859 | $305,406 | $21,416 | $283,990 |
| 2022 | $1,301 | $272,446 | $18,626 | $253,820 |
| 2021 | $873 | $209,675 | $14,065 | $195,610 |
| 2020 | $1,158 | $186,625 | $10,685 | $175,940 |
| 2019 | $1,281 | $167,735 | $0 | $0 |
| 2018 | $1,167 | $144,855 | $10,685 | $134,170 |
| 2017 | $1,168 | $151,225 | $8,525 | $142,700 |
| 2016 | $1,032 | $63,078 | $0 | $0 |
| 2015 | -- | $0 | $0 | $0 |
| 2014 | -- | $0 | $0 | $0 |
| 2012 | -- | $0 | $0 | $0 |
Source: Public Records
Map
Nearby Homes