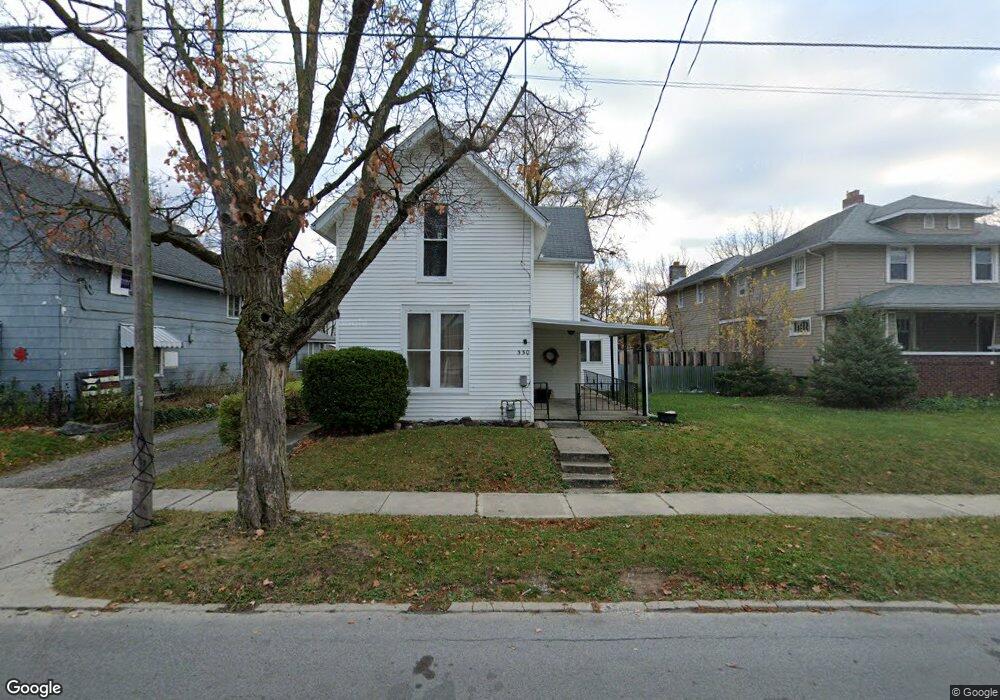
330 N Charles St Lima, OH 45805
Central Lima NeighborhoodEstimated Value: $139,018 - $197,000
3
Beds
1
Bath
1,652
Sq Ft
$102/Sq Ft
Est. Value
About This Home
This home is located at 330 N Charles St, Lima, OH 45805 and is currently estimated at $169,005, approximately $102 per square foot. 330 N Charles St is a home located in Allen County with nearby schools including Heritage Elementary School, Lima West Middle School, and Lima North Middle School.
Ownership History
Date
Name
Owned For
Owner Type
Purchase Details
Closed on
May 30, 2017
Sold by
Evans Thomas Wesley and Evans Kristi
Bought by
Smart Stacee E
Current Estimated Value
Home Financials for this Owner
Home Financials are based on the most recent Mortgage that was taken out on this home.
Original Mortgage
$111,065
Outstanding Balance
$92,534
Interest Rate
4.08%
Mortgage Type
New Conventional
Estimated Equity
$76,471
Purchase Details
Closed on
Apr 16, 1999
Sold by
Monford Brian
Bought by
Evans Thomas
Home Financials for this Owner
Home Financials are based on the most recent Mortgage that was taken out on this home.
Original Mortgage
$64,468
Interest Rate
7.1%
Mortgage Type
FHA
Purchase Details
Closed on
Mar 18, 1994
Sold by
Schoenhofer Michael A
Bought by
Monford Brian L and Monford Monford
Purchase Details
Closed on
Dec 4, 1990
Bought by
Schoenhofer Michael A
Create a Home Valuation Report for This Property
The Home Valuation Report is an in-depth analysis detailing your home's value as well as a comparison with similar homes in the area
Home Values in the Area
Average Home Value in this Area
Purchase History
| Date | Buyer | Sale Price | Title Company |
|---|---|---|---|
| Smart Stacee E | $114,666 | None Available | |
| Evans Thomas | $65,000 | -- | |
| Monford Brian L | $51,500 | -- | |
| Schoenhofer Michael A | $46,500 | -- |
Source: Public Records
Mortgage History
| Date | Status | Borrower | Loan Amount |
|---|---|---|---|
| Open | Smart Stacee E | $111,065 | |
| Previous Owner | Evans Thomas | $64,468 |
Source: Public Records
Tax History Compared to Growth
Tax History
| Year | Tax Paid | Tax Assessment Tax Assessment Total Assessment is a certain percentage of the fair market value that is determined by local assessors to be the total taxable value of land and additions on the property. | Land | Improvement |
|---|---|---|---|---|
| 2024 | $1,556 | $43,680 | $4,060 | $39,620 |
| 2023 | $1,450 | $35,490 | $3,290 | $32,200 |
| 2022 | $1,458 | $35,490 | $3,290 | $32,200 |
| 2021 | $1,549 | $35,490 | $3,290 | $32,200 |
| 2020 | $1,487 | $30,110 | $3,120 | $26,990 |
| 2019 | $1,487 | $30,110 | $3,120 | $26,990 |
| 2018 | $1,423 | $30,110 | $3,120 | $26,990 |
| 2017 | $1,376 | $27,660 | $3,120 | $24,540 |
| 2016 | $1,394 | $27,660 | $3,120 | $24,540 |
| 2015 | $1,404 | $27,660 | $3,120 | $24,540 |
| 2014 | $1,404 | $27,410 | $3,260 | $24,150 |
| 2013 | $1,366 | $27,410 | $3,260 | $24,150 |
Source: Public Records
Map
Nearby Homes
- 1036 W High St
- 618 Woodward Ave
- 1120 Richie Ave
- 1023 Leland Ave
- 745 Brice Ave
- 631 Hazel Ave
- 1206 Rice Ave
- 648 Hazel Ave
- 638 Hazel Ave
- 627 Brice Ave
- 705 W Elm St
- 612 N Metcalf St
- 343 S Charles St
- 434 N Washington St
- 233 S Kenilworth Ave
- 708 N Metcalf St
- 676 Cortlandt Ave
- 325 N McDonel St
- 419 S Collett St
- 1517 Allentown Rd