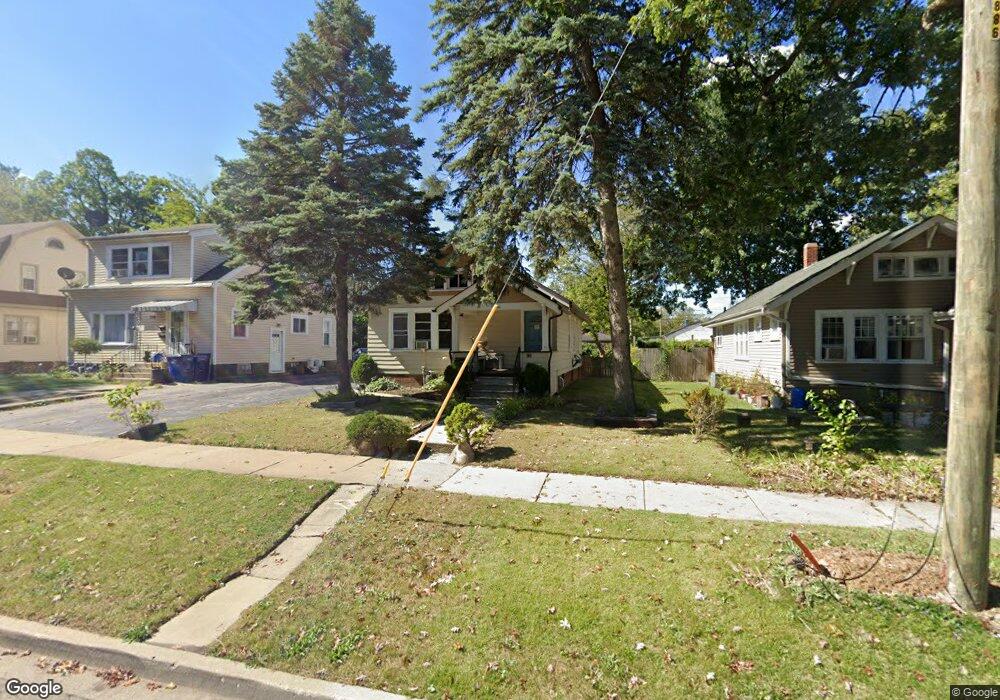
330 N Jackson St Waukegan, IL 60085
Lyon Grove NeighborhoodEstimated Value: $179,000 - $205,000
2
Beds
2
Baths
960
Sq Ft
$201/Sq Ft
Est. Value
About This Home
This home is located at 330 N Jackson St, Waukegan, IL 60085 and is currently estimated at $192,658, approximately $200 per square foot. 330 N Jackson St is a home located in Lake County with nearby schools including H R McCall Elementary School, Miguel Juarez Middle School, and Waukegan High School.
Ownership History
Date
Name
Owned For
Owner Type
Purchase Details
Closed on
Sep 26, 2017
Sold by
Sbm Group Inc
Bought by
Cervantes Alexis R
Current Estimated Value
Home Financials for this Owner
Home Financials are based on the most recent Mortgage that was taken out on this home.
Original Mortgage
$92,297
Outstanding Balance
$78,457
Interest Rate
4.5%
Mortgage Type
FHA
Estimated Equity
$114,201
Purchase Details
Closed on
Jun 2, 2017
Sold by
Carter
Bought by
Sbm Group Inc
Purchase Details
Closed on
Apr 2, 2009
Sold by
Tadayoni Abdollah
Bought by
Carter Marvin and Betram Carter Mary
Home Financials for this Owner
Home Financials are based on the most recent Mortgage that was taken out on this home.
Original Mortgage
$111,343
Interest Rate
5.05%
Mortgage Type
VA
Purchase Details
Closed on
Jul 24, 2008
Sold by
Blair Steven W and Estate Of Charles H Blair
Bought by
Tadayoni Abdollah
Create a Home Valuation Report for This Property
The Home Valuation Report is an in-depth analysis detailing your home's value as well as a comparison with similar homes in the area
Home Values in the Area
Average Home Value in this Area
Purchase History
| Date | Buyer | Sale Price | Title Company |
|---|---|---|---|
| Cervantes Alexis R | $94,000 | Chicago Title Company | |
| Sbm Group Inc | $55,000 | Chicago Title | |
| Carter Marvin | $109,000 | Multiple | |
| Tadayoni Abdollah | $35,000 | First American Title |
Source: Public Records
Mortgage History
| Date | Status | Borrower | Loan Amount |
|---|---|---|---|
| Open | Cervantes Alexis R | $92,297 | |
| Previous Owner | Carter Marvin | $111,343 |
Source: Public Records
Tax History Compared to Growth
Tax History
| Year | Tax Paid | Tax Assessment Tax Assessment Total Assessment is a certain percentage of the fair market value that is determined by local assessors to be the total taxable value of land and additions on the property. | Land | Improvement |
|---|---|---|---|---|
| 2024 | $3,570 | $43,065 | $9,390 | $33,675 |
| 2023 | $2,611 | $37,856 | $7,707 | $30,149 |
| 2022 | $2,611 | $32,709 | $6,667 | $26,042 |
| 2021 | $2,291 | $27,973 | $5,721 | $22,252 |
| 2020 | $2,274 | $26,060 | $5,330 | $20,730 |
| 2019 | $2,236 | $23,880 | $4,884 | $18,996 |
| 2018 | $2,115 | $21,016 | $5,529 | $15,487 |
| 2017 | $2,236 | $15,720 | $4,892 | $10,828 |
| 2016 | $2,111 | $13,660 | $4,251 | $9,409 |
| 2015 | $2,065 | $12,226 | $3,805 | $8,421 |
| 2014 | $3,266 | $19,304 | $3,679 | $15,625 |
| 2012 | $4,048 | $20,915 | $3,986 | $16,929 |
Source: Public Records
Map
Nearby Homes
- 511 Chestnut St
- 428 N Poplar St
- 522 N Poplar St
- 23 N Jackson St
- 702 Franklin St
- 1416 Hamilton Ct
- 620 N Poplar St
- 28 N Saint James St
- 452 North Ave
- 1109 Massena Ave
- 824 N Butrick St
- 613 Washington St
- 917 N Linden Ave
- 1521 Catalpa Ave
- 557 W Water St
- 1000 Pine St
- 918 N Ash St
- 610 Bluff St
- 325 4th St
- 222 Grand Ave
- 326 N Jackson St
- 334 N Jackson St
- 322 N Jackson St
- 338 N Jackson St
- 1111 Jackson Ct
- 329 Edison Ct
- 325 Edison Ct
- 340 N Jackson St
- 318 N Jackson St
- 333 Edison Ct
- 321 Edison Ct
- 319 Edison Ct
- 1022 Rogers Ct
- 1014 Rogers Ct
- 315 Edison Ct
- 325 N Jackson St
- 310 N Jackson St
- 1012 Rogers Ct
- 321 N Jackson St
- 1124 Jackson Ct