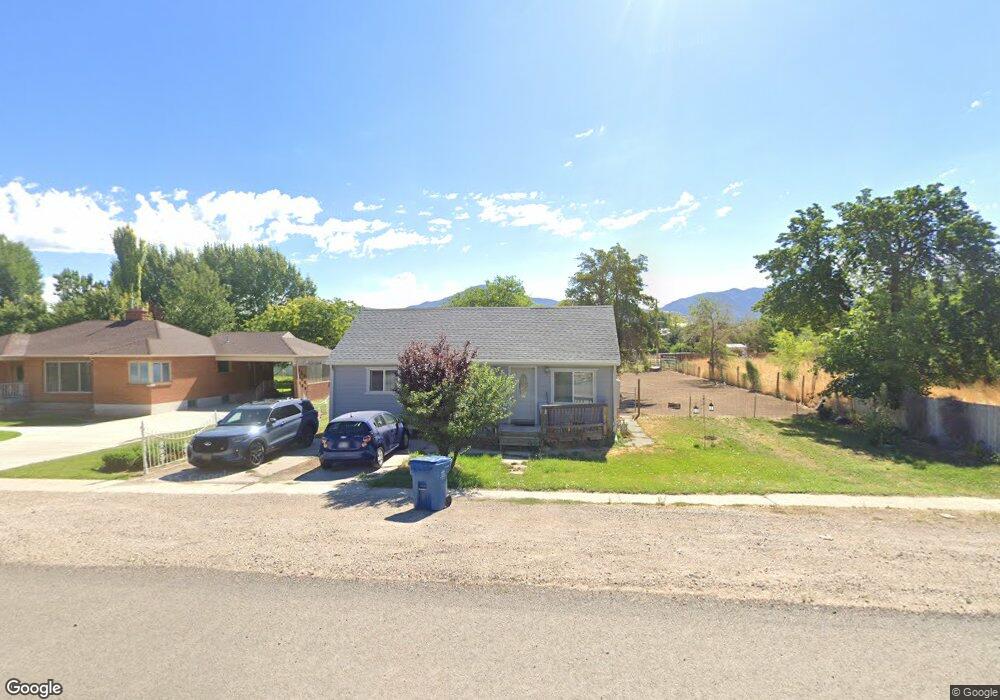
330 N Main St Fillmore, UT 84631
Estimated Value: $253,000 - $331,000
3
Beds
2
Baths
1,612
Sq Ft
$178/Sq Ft
Est. Value
About This Home
This home is located at 330 N Main St, Fillmore, UT 84631 and is currently estimated at $286,716, approximately $177 per square foot. 330 N Main St is a home located in Millard County.
Ownership History
Date
Name
Owned For
Owner Type
Purchase Details
Closed on
Oct 16, 2012
Sold by
Burton Anjelina E
Bought by
Levi Sandra
Current Estimated Value
Home Financials for this Owner
Home Financials are based on the most recent Mortgage that was taken out on this home.
Original Mortgage
$101,989
Outstanding Balance
$70,105
Interest Rate
3.43%
Estimated Equity
$216,611
Purchase Details
Closed on
Jul 30, 2007
Sold by
Quinteros Kirsten
Bought by
Burton Anjelina E
Home Financials for this Owner
Home Financials are based on the most recent Mortgage that was taken out on this home.
Original Mortgage
$64,000
Interest Rate
6.65%
Mortgage Type
New Conventional
Purchase Details
Closed on
Oct 26, 2005
Sold by
Quinreros Kirsten
Bought by
Quinteros Kirsten
Home Financials for this Owner
Home Financials are based on the most recent Mortgage that was taken out on this home.
Original Mortgage
$64,000
Interest Rate
5.9%
Mortgage Type
New Conventional
Create a Home Valuation Report for This Property
The Home Valuation Report is an in-depth analysis detailing your home's value as well as a comparison with similar homes in the area
Home Values in the Area
Average Home Value in this Area
Purchase History
| Date | Buyer | Sale Price | Title Company |
|---|---|---|---|
| Levi Sandra | -- | First American Title Insuran | |
| Burton Anjelina E | -- | -- | |
| Quinteros Kirsten | -- | First American Title Insuran |
Source: Public Records
Mortgage History
| Date | Status | Borrower | Loan Amount |
|---|---|---|---|
| Open | Levi Sandra | $101,989 | |
| Previous Owner | Burton Anjelina E | $64,000 | |
| Previous Owner | Quinteros Kirsten | $64,000 |
Source: Public Records
Tax History Compared to Growth
Tax History
| Year | Tax Paid | Tax Assessment Tax Assessment Total Assessment is a certain percentage of the fair market value that is determined by local assessors to be the total taxable value of land and additions on the property. | Land | Improvement |
|---|---|---|---|---|
| 2025 | $1,010 | $126,818 | $31,204 | $95,614 |
| 2024 | $1,010 | $107,696 | $20,292 | $87,404 |
| 2023 | $1,197 | $107,696 | $20,292 | $87,404 |
| 2022 | $953 | $85,599 | $18,448 | $67,151 |
| 2021 | $825 | $71,136 | $11,979 | $59,157 |
| 2020 | $764 | $66,210 | $10,890 | $55,320 |
| 2019 | $655 | $56,956 | $10,890 | $46,066 |
| 2018 | $625 | $55,657 | $10,890 | $44,767 |
| 2017 | $582 | $49,236 | $10,890 | $38,346 |
| 2016 | $556 | $49,236 | $10,890 | $38,346 |
| 2015 | $557 | $49,236 | $10,890 | $38,346 |
| 2014 | -- | $49,236 | $10,890 | $38,346 |
| 2013 | -- | $49,236 | $10,890 | $38,346 |
Source: Public Records
Map
Nearby Homes
- 390 N 100 W
- 295 N 100 West St
- 380 N 200 St W
- 165 N 100 W
- 225 W 200 St N
- 75 N 100 West St
- 335 W 400 North St
- 40 S 100 Rd E
- 120 S 100 East Rd
- 220 S 200 E
- 410 W 400 N
- 430 E Canyon Rd
- 190 W 400 St S
- 310 S 600 E
- 310 S 500 West Rd
- 155 E 500 St S
- 157 E 500 South St
- 2155 N Cedar Mountain Rd
- 2835 N Cedar Mountain Rd
- 405 E 500 St S