Estimated Value: $377,000 - $568,000
3
Beds
2
Baths
1,452
Sq Ft
$297/Sq Ft
Est. Value
About This Home
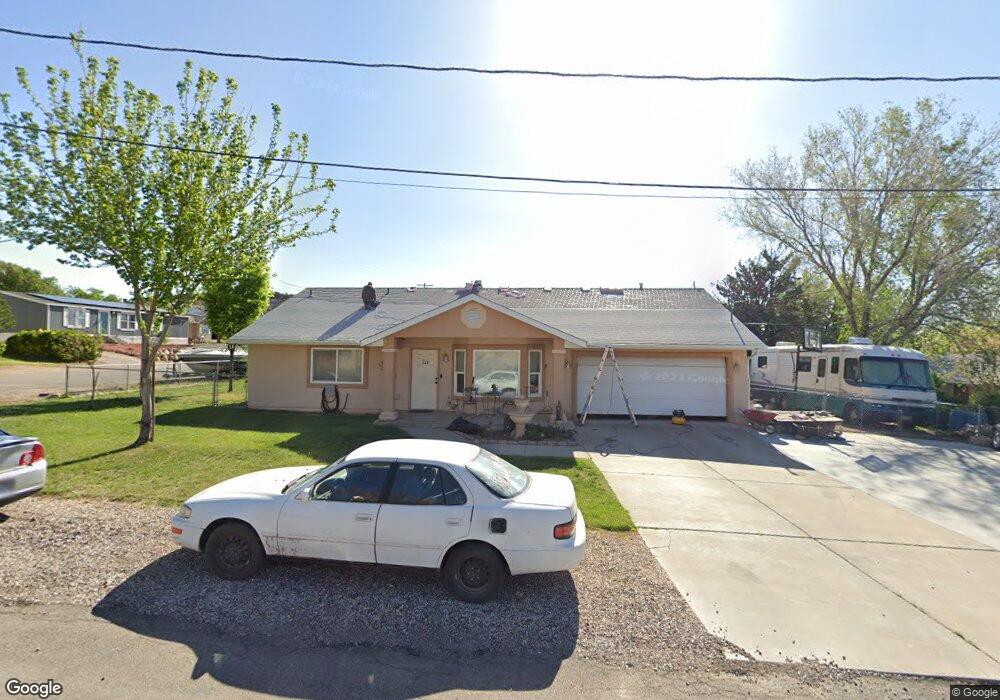
This home is located at 330 N Mesa View Ave, Leeds, UT 84746 and is currently estimated at $430,627, approximately $296 per square foot. 330 N Mesa View Ave is a home with nearby schools including Coral Canyon School, Pine View Middle School, and Fossil Ridge Intermediate School.
Ownership History
Date
Name
Owned For
Owner Type
Purchase Details
Closed on
Jan 6, 2013
Sold by
J & L Alliance Inc
Bought by
Connor Travis E and Connor Darcy Rae
Current Estimated Value
Home Financials for this Owner
Home Financials are based on the most recent Mortgage that was taken out on this home.
Original Mortgage
$101,772
Interest Rate
4.26%
Mortgage Type
FHA
Purchase Details
Closed on
Oct 1, 2005
Sold by
Jimerson Joseph T and Jimerson Lynette R
Bought by
J & L Alliance Inc
Purchase Details
Closed on
Jul 26, 2005
Sold by
Jimerson Joseph T and Jimerson Lynette R
Bought by
Jimerson Joseph T and Jimerson Lynette R
Home Financials for this Owner
Home Financials are based on the most recent Mortgage that was taken out on this home.
Original Mortgage
$72,000
Interest Rate
5.46%
Mortgage Type
Purchase Money Mortgage
Create a Home Valuation Report for This Property
The Home Valuation Report is an in-depth analysis detailing your home's value as well as a comparison with similar homes in the area
Purchase History
| Date | Buyer | Sale Price | Title Company |
|---|---|---|---|
| Connor Travis E | -- | Title Guarantee St George | |
| J & L Alliance Inc | -- | None Available | |
| Jimerson Joseph T | -- | Southern Utah Title Co |
Source: Public Records
Mortgage History
| Date | Status | Borrower | Loan Amount |
|---|---|---|---|
| Previous Owner | Connor Travis E | $101,772 | |
| Previous Owner | Jimerson Joseph T | $72,000 |
Source: Public Records
Tax History
| Year | Tax Paid | Tax Assessment Tax Assessment Total Assessment is a certain percentage of the fair market value that is determined by local assessors to be the total taxable value of land and additions on the property. | Land | Improvement |
|---|---|---|---|---|
| 2025 | $1,470 | $210,485 | $44,550 | $165,935 |
| 2023 | $1,475 | $210,265 | $44,550 | $165,715 |
| 2022 | $1,438 | $192,830 | $39,600 | $153,230 |
| 2021 | $1,315 | $261,300 | $58,500 | $202,800 |
| 2020 | $1,243 | $231,500 | $58,500 | $173,000 |
| 2019 | $1,056 | $190,500 | $54,000 | $136,500 |
| 2018 | $1,033 | $92,290 | $0 | $0 |
| 2017 | $840 | $75,130 | $0 | $0 |
| 2016 | $861 | $75,075 | $0 | $0 |
| 2015 | $755 | $61,270 | $0 | $0 |
| 2014 | $1,312 | $107,400 | $0 | $0 |
Source: Public Records
Map
Nearby Homes
- 89 E Vista Ave
- 230 Boulder Way
- 70 E Roundy Mountain Rd
- 0 Parcel: L-See-1 Unit 25-267177
- 140 N Main St
- 0 Parcel: L-See-4 Unit 25-267319
- 0 Parcel: L-See-6 Unit 25-267324
- 0 Parcel: L-See-3 Unit 25-267317
- 0 Parcel: L-See-2 Unit 25-267310
- 0 Unit 25-267349
- 0 Unit 25-267322
- 0 Parcel: L-See-10 Unit 25-267339
- 0 Parcel: L-See-13 Unit 25-267474
- 0 Parcel: L-See-7 Unit 25-267335
- 0 Parcel: L-See-14 Unit 25-267352
- 0 Parcel: L-See-9 Unit 25-267337
- 0 Parcel: L-See-8 Unit 25-267336
- 0 Unit 25-267346
- 95 W Center St
- 415 W Silver Hills Rd
Your Personal Tour Guide
Ask me questions while you tour the home.