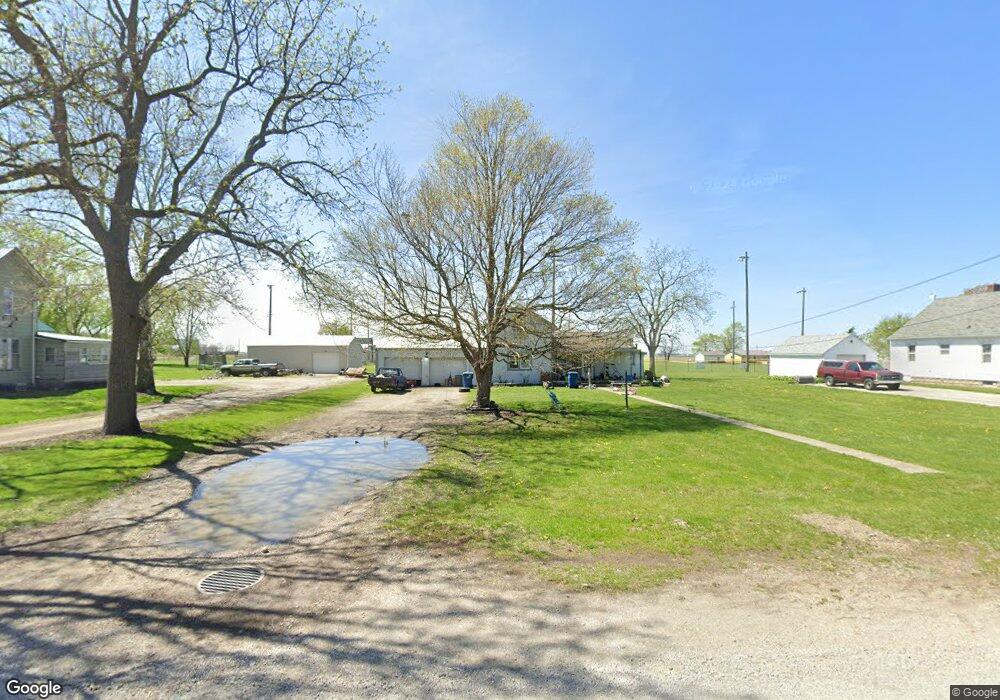
330 N Newton St Unit 1 Goodland, IN 47948
Estimated Value: $120,000 - $156,000
4
Beds
2
Baths
1,356
Sq Ft
$98/Sq Ft
Est. Value
About This Home
This home is located at 330 N Newton St Unit 1, Goodland, IN 47948 and is currently estimated at $132,797, approximately $97 per square foot. 330 N Newton St Unit 1 is a home located in Newton County with nearby schools including South Newton Elementary School, South Newton Middle School, and South Newton Senior High School.
Ownership History
Date
Name
Owned For
Owner Type
Purchase Details
Closed on
Dec 29, 2009
Sold by
Bank Of New York Mellon
Bought by
Stone Ernest A and Stone Bonnie S
Current Estimated Value
Purchase Details
Closed on
Oct 19, 2009
Sold by
Bac Home Loans Servicing Lp F
Bought by
The Bank Of New York Mellon Fk
Purchase Details
Closed on
Sep 3, 2009
Sold by
Donald Hartman
Bought by
Countrywide Home Loans Servicing Lp
Create a Home Valuation Report for This Property
The Home Valuation Report is an in-depth analysis detailing your home's value as well as a comparison with similar homes in the area
Home Values in the Area
Average Home Value in this Area
Purchase History
| Date | Buyer | Sale Price | Title Company |
|---|---|---|---|
| Stone Ernest A | $41,000 | Meridan Title Corporation | |
| The Bank Of New York Mellon Fk | $3,400 | Unterberg & Associates, P.C. | |
| Countrywide Home Loans Servicing Lp | $34,000 | Unterberg & Assoc. P.C. |
Source: Public Records
Tax History Compared to Growth
Tax History
| Year | Tax Paid | Tax Assessment Tax Assessment Total Assessment is a certain percentage of the fair market value that is determined by local assessors to be the total taxable value of land and additions on the property. | Land | Improvement |
|---|---|---|---|---|
| 2024 | $470 | $73,000 | $14,700 | $58,300 |
| 2023 | $470 | $67,600 | $14,700 | $52,900 |
| 2022 | $434 | $67,100 | $14,700 | $52,400 |
| 2021 | $407 | $59,600 | $13,700 | $45,900 |
| 2020 | $420 | $59,700 | $13,700 | $46,000 |
| 2019 | $349 | $54,000 | $13,700 | $40,300 |
| 2018 | $336 | $54,000 | $13,700 | $40,300 |
| 2017 | $324 | $54,100 | $9,800 | $44,300 |
| 2016 | $283 | $48,700 | $9,800 | $38,900 |
| 2014 | $224 | $41,900 | $9,800 | $32,100 |
| 2013 | $224 | $39,800 | $9,800 | $30,000 |
Source: Public Records
Map
Nearby Homes
- 330 N Newton St
- 334 N Newton St
- 326 N Newton St
- 404 N Newton St
- 327 N Newton St
- 318 N Newton St
- 331 N Newton St
- 323 N Newton St
- 408 N Newton St
- 401 N Newton St
- 319 N Newton St
- 407 N Newton St
- 314 N Newton St
- 315 N Newton St
- 409 N Newton St
- 313 N Newton St
- 313 N Newton St Unit 1
- 416 N Newton St
- 324 N James St
- 413 N Newton St