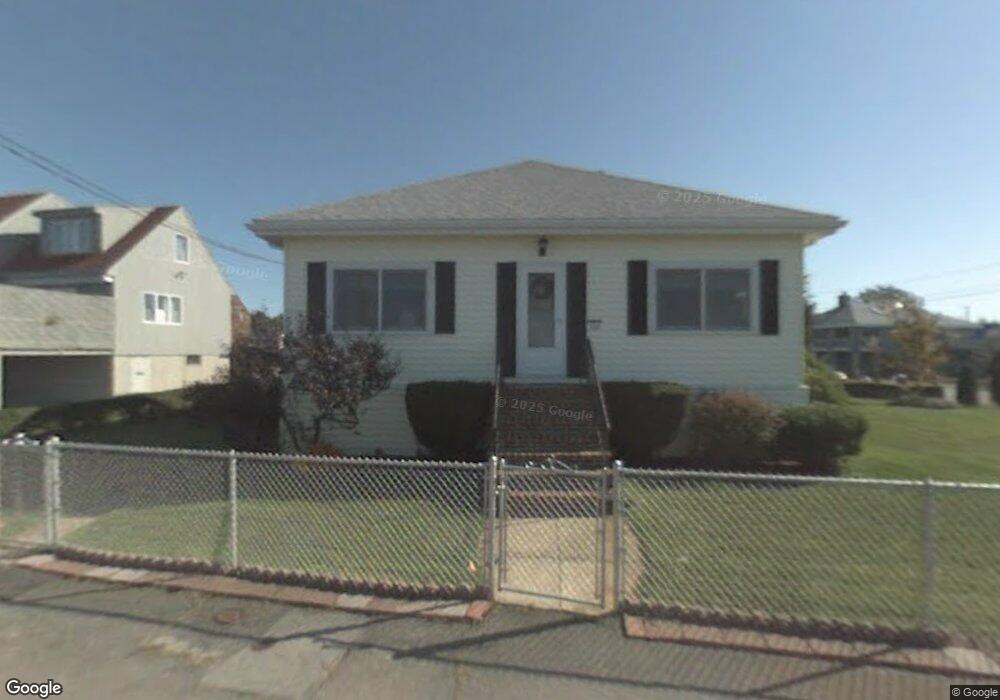
330 Newport Rd Hull, MA 02045
Strawberry Hill NeighborhoodEstimated Value: $638,000 - $804,000
3
Beds
2
Baths
2,211
Sq Ft
$311/Sq Ft
Est. Value
About This Home
This home is located at 330 Newport Rd, Hull, MA 02045 and is currently estimated at $686,532, approximately $310 per square foot. 330 Newport Rd is a home located in Plymouth County with nearby schools including Lillian M. Jacobs Elementary School, Memorial Middle School, and Hull High School.
Ownership History
Date
Name
Owned For
Owner Type
Purchase Details
Closed on
Mar 1, 2019
Sold by
Purvis Mary L
Bought by
Mary L Purvis T L and Mary Flynn
Current Estimated Value
Purchase Details
Closed on
Aug 20, 2004
Sold by
Purvis William Frederi
Bought by
Purvis William F and Purvis Mary L
Purchase Details
Closed on
Aug 1, 1970
Bought by
330 Newport Rd Rt
Create a Home Valuation Report for This Property
The Home Valuation Report is an in-depth analysis detailing your home's value as well as a comparison with similar homes in the area
Home Values in the Area
Average Home Value in this Area
Purchase History
| Date | Buyer | Sale Price | Title Company |
|---|---|---|---|
| Mary L Purvis T L | -- | -- | |
| Purvis Mary L | -- | -- | |
| Purvis William F | -- | -- | |
| 330 Newport R | -- | -- | |
| 330 Newport Rd Rt | -- | -- |
Source: Public Records
Mortgage History
| Date | Status | Borrower | Loan Amount |
|---|---|---|---|
| Previous Owner | 330 Newport Rd Rt | $15,000 | |
| Previous Owner | 330 Newport Rd Rt | $5,831 | |
| Previous Owner | 330 Newport Rd Rt | $10,698 |
Source: Public Records
Tax History Compared to Growth
Tax History
| Year | Tax Paid | Tax Assessment Tax Assessment Total Assessment is a certain percentage of the fair market value that is determined by local assessors to be the total taxable value of land and additions on the property. | Land | Improvement |
|---|---|---|---|---|
| 2025 | $5,545 | $495,100 | $266,000 | $229,100 |
| 2024 | $5,488 | $471,100 | $258,200 | $212,900 |
| 2023 | $5,591 | $459,400 | $258,200 | $201,200 |
| 2022 | $5,622 | $448,300 | $258,200 | $190,100 |
| 2021 | $5,353 | $422,200 | $234,700 | $187,500 |
| 2020 | $5,272 | $411,200 | $226,900 | $184,300 |
| 2019 | $5,096 | $390,500 | $219,100 | $171,400 |
| 2018 | $4,948 | $368,700 | $219,100 | $149,600 |
| 2017 | $4,882 | $355,800 | $219,100 | $136,700 |
| 2016 | $5,006 | $371,400 | $234,700 | $136,700 |
| 2015 | $4,632 | $332,300 | $195,600 | $136,700 |
| 2014 | $4,484 | $323,300 | $195,600 | $127,700 |
Source: Public Records
Map
Nearby Homes