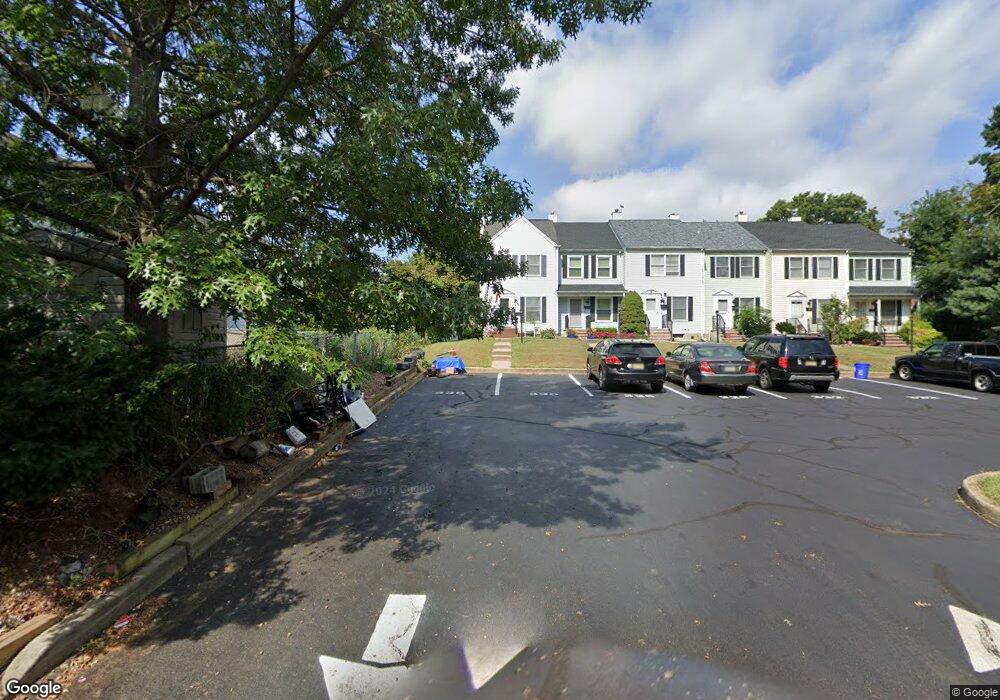
330 Railroad Place Manville, NJ 08835
Estimated Value: $326,000 - $426,000
--
Bed
--
Bath
1,020
Sq Ft
$366/Sq Ft
Est. Value
About This Home
This home is located at 330 Railroad Place, Manville, NJ 08835 and is currently estimated at $373,458, approximately $366 per square foot. 330 Railroad Place is a home located in Somerset County with nearby schools including Weston Elementary School, Roosevelt School, and Alexander Batcho Intermediate School (ABIS).
Ownership History
Date
Name
Owned For
Owner Type
Purchase Details
Closed on
Aug 17, 2009
Sold by
Adams Rick S and Adams Angela M
Bought by
Adams Angela M
Current Estimated Value
Purchase Details
Closed on
Mar 19, 1997
Sold by
Raksa Pauline
Bought by
Adams Rick and Adams Angela
Home Financials for this Owner
Home Financials are based on the most recent Mortgage that was taken out on this home.
Original Mortgage
$90,000
Outstanding Balance
$10,856
Interest Rate
7.68%
Estimated Equity
$362,602
Purchase Details
Closed on
Jul 28, 1989
Sold by
Raksa Matthew C and Raksa Pauline
Bought by
Raksa Matthew C
Create a Home Valuation Report for This Property
The Home Valuation Report is an in-depth analysis detailing your home's value as well as a comparison with similar homes in the area
Home Values in the Area
Average Home Value in this Area
Purchase History
| Date | Buyer | Sale Price | Title Company |
|---|---|---|---|
| Adams Angela M | -- | None Available | |
| Adams Rick | $93,000 | -- | |
| Raksa Matthew C | $100 | -- |
Source: Public Records
Mortgage History
| Date | Status | Borrower | Loan Amount |
|---|---|---|---|
| Open | Adams Rick | $90,000 |
Source: Public Records
Tax History Compared to Growth
Tax History
| Year | Tax Paid | Tax Assessment Tax Assessment Total Assessment is a certain percentage of the fair market value that is determined by local assessors to be the total taxable value of land and additions on the property. | Land | Improvement |
|---|---|---|---|---|
| 2025 | $6,388 | $326,300 | $210,000 | $116,300 |
| 2024 | $6,388 | $283,800 | $168,000 | $115,800 |
| 2023 | $6,039 | $251,200 | $136,500 | $114,700 |
| 2022 | $5,143 | $196,600 | $115,500 | $81,100 |
| 2021 | $5,527 | $200,700 | $115,500 | $85,200 |
| 2020 | $5,908 | $187,600 | $105,000 | $82,600 |
| 2019 | $5,083 | $155,600 | $78,800 | $76,800 |
| 2018 | $5,127 | $156,800 | $78,800 | $78,000 |
| 2017 | $5,113 | $159,100 | $78,800 | $80,300 |
| 2016 | $4,929 | $159,100 | $78,800 | $80,300 |
| 2015 | $5,571 | $230,500 | $147,000 | $83,500 |
| 2014 | $5,461 | $230,500 | $147,000 | $83,500 |
Source: Public Records
Map
Nearby Homes