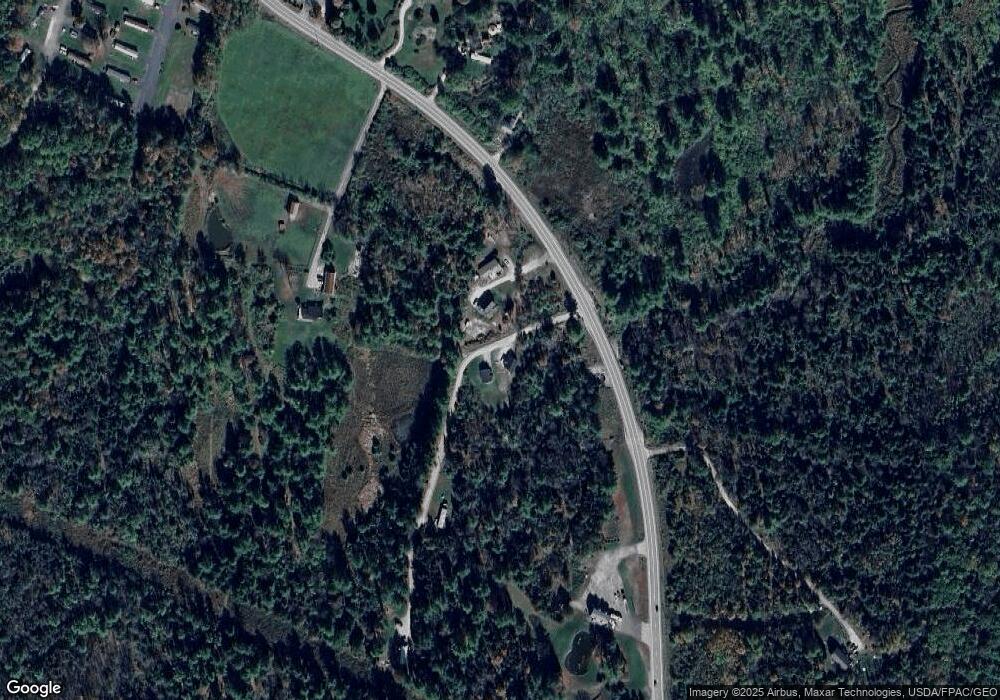
330 Ridge Rd Lisbon Falls, ME 04252
Estimated Value: $320,000 - $340,000
3
Beds
2
Baths
1,188
Sq Ft
$277/Sq Ft
Est. Value
About This Home
This is the newest property built by The Maine Home Collective! With Quartz countertops, custom cabinetry, heat pumps that provide heat in the winter and A/C in the summer, high end finishes, and laundry hook ups, this house is ready to make someone a home.
Ownership History
Date
Name
Owned For
Owner Type
Purchase Details
Closed on
Jun 27, 2024
Sold by
Mason Garrett P
Bought by
Mason Garrett P and Mason Rebekah A
Current Estimated Value
Home Financials for this Owner
Home Financials are based on the most recent Mortgage that was taken out on this home.
Original Mortgage
$210,000
Outstanding Balance
$207,506
Interest Rate
7.02%
Mortgage Type
Adjustable Rate Mortgage/ARM
Estimated Equity
$121,827
Create a Home Valuation Report for This Property
The Home Valuation Report is an in-depth analysis detailing your home's value as well as a comparison with similar homes in the area
Home Values in the Area
Average Home Value in this Area
Purchase History
| Date | Buyer | Sale Price | Title Company |
|---|---|---|---|
| Mason Garrett P | -- | Misc Company |
Source: Public Records
Mortgage History
| Date | Status | Borrower | Loan Amount |
|---|---|---|---|
| Open | Mason Garrett P | $210,000 |
Source: Public Records
Property History
| Date | Event | Price | List to Sale | Price per Sq Ft |
|---|---|---|---|---|
| 02/07/2025 02/07/25 | Off Market | -- | -- | -- |
| 01/23/2025 01/23/25 | For Rent | -- | -- | -- |
Tax History Compared to Growth
Tax History
| Year | Tax Paid | Tax Assessment Tax Assessment Total Assessment is a certain percentage of the fair market value that is determined by local assessors to be the total taxable value of land and additions on the property. | Land | Improvement |
|---|---|---|---|---|
| 2024 | $1,888 | $138,800 | $73,500 | $65,300 |
| 2023 | $2,720 | $128,900 | $47,900 | $81,000 |
| 2022 | $2,978 | $128,900 | $47,900 | $81,000 |
| 2021 | $2,849 | $128,900 | $47,900 | $81,000 |
| 2020 | $2,978 | $128,900 | $47,900 | $81,000 |
| 2019 | $2,978 | $128,900 | $47,900 | $81,000 |
| 2018 | $2,807 | $113,000 | $41,700 | $71,300 |
| 2017 | $2,434 | $104,900 | $41,700 | $63,200 |
| 2016 | $2,350 | $104,900 | $41,700 | $63,200 |
| 2015 | $2,131 | $90,340 | $35,020 | $55,320 |
| 2014 | $2,204 | $90,340 | $35,020 | $55,320 |
Source: Public Records
Map
Nearby Homes
- 202 Bowdoinham Rd
- 62 Birchwood Dr
- 143 Dube Dr
- 13 Saint Ann St
- 4 Hayfield Ln
- 219 Lisbon St
- M.R6 Lot18 Lisbon St
- 25 Wine Time Cir
- 29 Begin Terrace
- 103 Lisbon St
- 272 Lisbon St
- 5 Bonafide St
- 17 Rita Dr
- 376 Bowdoinham Rd
- 16 Pauline St
- 51 Gould Rd
- 20 Town And Country Dr
- 38 Fairview Dr
- 48 Fairview Dr
- 44 Fairview Dr
