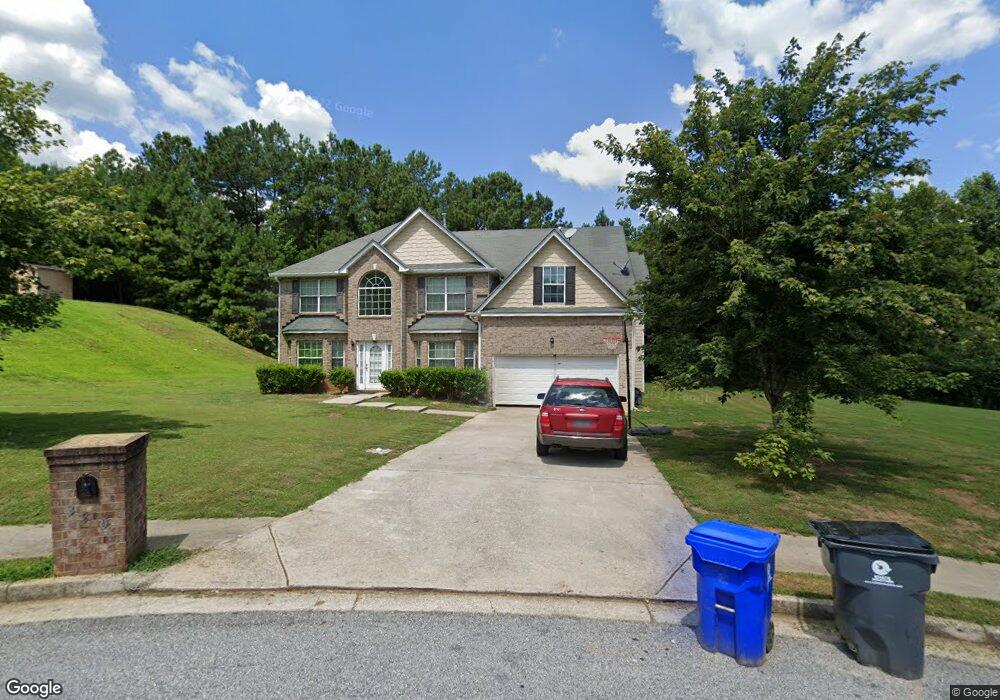
330 Riverview Ct Fairburn, GA 30213
Estimated Value: $358,000 - $412,000
5
Beds
3
Baths
3,311
Sq Ft
$117/Sq Ft
Est. Value
About This Home
This home is located at 330 Riverview Ct, Fairburn, GA 30213 and is currently estimated at $388,602, approximately $117 per square foot. 330 Riverview Ct is a home located in Fulton County with nearby schools including E. C. West Elementary School, Bear Creek Middle School, and Creekside High School.
Ownership History
Date
Name
Owned For
Owner Type
Purchase Details
Closed on
Feb 8, 2018
Sold by
2018 1 Ih Borrower Lp
Bought by
Srp Sub Llc
Current Estimated Value
Purchase Details
Closed on
Jun 30, 2014
Sold by
Colfin Ai Ga 1
Bought by
Cah 2014 2 Borrower Llc
Purchase Details
Closed on
Jan 2, 2013
Sold by
Seymour Michael
Bought by
Colfin Ai Ga1 Llc
Purchase Details
Closed on
Mar 9, 2007
Sold by
Legacy Communities Of Rivervie
Bought by
Seymour Michael
Home Financials for this Owner
Home Financials are based on the most recent Mortgage that was taken out on this home.
Original Mortgage
$201,300
Interest Rate
8.18%
Mortgage Type
New Conventional
Create a Home Valuation Report for This Property
The Home Valuation Report is an in-depth analysis detailing your home's value as well as a comparison with similar homes in the area
Home Values in the Area
Average Home Value in this Area
Purchase History
| Date | Buyer | Sale Price | Title Company |
|---|---|---|---|
| Srp Sub Llc | -- | -- | |
| Cah 2014 2 Borrower Llc | -- | -- | |
| Colfin Ai Ga1 Llc | $134,500 | -- | |
| The Bank Of New York Mellon Tr | -- | -- | |
| Seymour Michael | $251,700 | -- |
Source: Public Records
Mortgage History
| Date | Status | Borrower | Loan Amount |
|---|---|---|---|
| Previous Owner | Seymour Michael | $201,300 |
Source: Public Records
Tax History
| Year | Tax Paid | Tax Assessment Tax Assessment Total Assessment is a certain percentage of the fair market value that is determined by local assessors to be the total taxable value of land and additions on the property. | Land | Improvement |
|---|---|---|---|---|
| 2025 | $1,375 | $164,080 | $42,040 | $122,040 |
| 2023 | $4,060 | $143,840 | $35,880 | $107,960 |
| 2022 | $4,913 | $186,720 | $35,880 | $150,840 |
| 2021 | $2,858 | $105,360 | $14,320 | $91,040 |
| 2020 | $3,443 | $105,360 | $14,320 | $91,040 |
| 2019 | $1,069 | $111,800 | $14,320 | $97,480 |
| 2018 | $2,049 | $109,160 | $14,000 | $95,160 |
| 2017 | $2,118 | $72,600 | $12,680 | $59,920 |
| 2016 | $2,119 | $72,600 | $12,680 | $59,920 |
| 2015 | $2,127 | $72,600 | $12,680 | $59,920 |
| 2014 | $1,892 | $72,600 | $12,680 | $59,920 |
Source: Public Records
Map
Nearby Homes
- 850 Tall Deer Dr
- 0 Cascade Palmetto Highway #76 Unit 10712384
- 306 Lowebrook Ct
- 0 Cascade Palmetto Highway #76 Unit 7736851
- 779 Pinehurst Dr
- 871 Tall Deer Dr
- 6570 Rivertown Rd
- 7580- LOT 20 Rivertown Rd
- 7580 B Rivertown Rd
- 7580- LOT 22 Rivertown Rd
- 2120 Village Green Dr
- 404 Park Place
- lot 3 Lake Esther Dr
- 0 Argus Dr Unit 7712819
- 0 Lake Esther Dr Unit 7705907
- 0 Lake Esther Dr Unit LOT 2
- 0 Lake Esther Dr Unit LOT 1
- 0 Lake Esther Dr Unit 7705916
- 344 Jarrett St
- 342 Jarrett St Unit 58
- 324 Riverview Ct
- 336 Riverview Ct
- 333 Riverview Ct
- 318 Riverview Ct
- 321 Riverview Ct
- 327 Riverview Ct
- 315 Riverview Ct
- 7062 Spruce Cir
- 312 Riverview Ct
- 7058 Spruce Cir
- 7068 Spruce Cir Unit 62
- 7068 Spruce Cir
- 7115 Magnolia Ln
- 7115 Magnolia Ln Unit 56
- 7105 Magnolia Ln
- 7125 Magnolia Ln
- 1225 Colony Trail
- 7045 Magnolia Ln
- 306 Riverview Ct
- 7095 Magnolia Ln
Your Personal Tour Guide
Ask me questions while you tour the home.