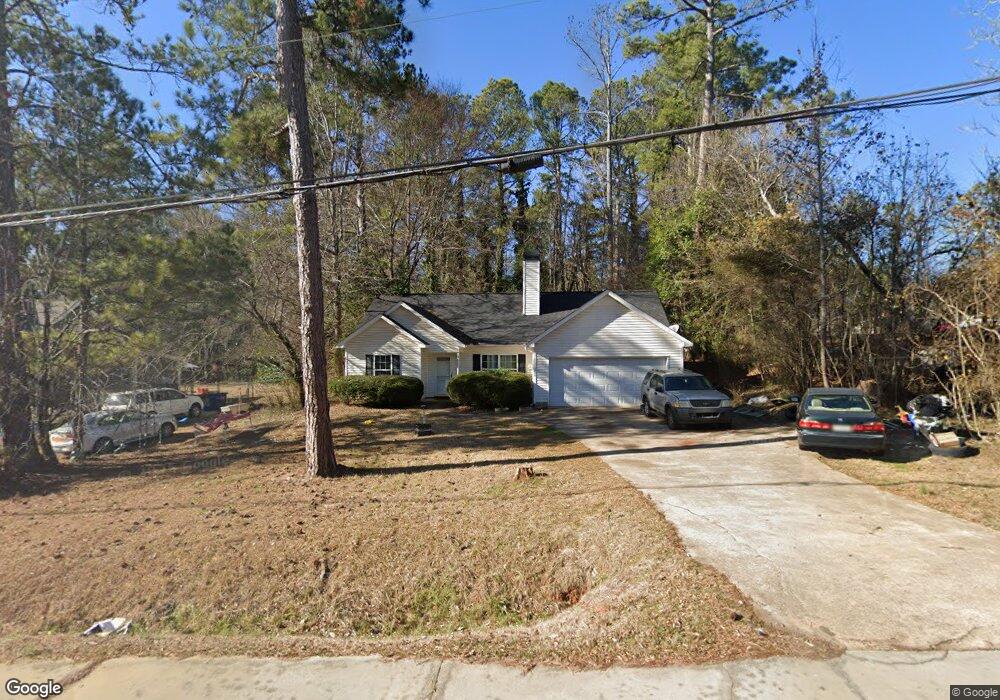
330 Roberts Rd Athens, GA 30606
Estimated Value: $260,000 - $276,000
3
Beds
2
Baths
1,216
Sq Ft
$220/Sq Ft
Est. Value
About This Home
This home is located at 330 Roberts Rd, Athens, GA 30606 and is currently estimated at $267,489, approximately $219 per square foot. 330 Roberts Rd is a home located in Clarke County with nearby schools including Whitehead Road Elementary School, Burney-Harris-Lyons Middle School, and Clarke Central High School.
Ownership History
Date
Name
Owned For
Owner Type
Purchase Details
Closed on
Apr 2, 2007
Sold by
Not Provided
Bought by
Goodrich Ryle
Current Estimated Value
Home Financials for this Owner
Home Financials are based on the most recent Mortgage that was taken out on this home.
Original Mortgage
$87,200
Outstanding Balance
$52,200
Interest Rate
6.15%
Mortgage Type
New Conventional
Estimated Equity
$215,289
Purchase Details
Closed on
Oct 3, 2006
Sold by
Not Provided
Bought by
Goodrich Ryle
Purchase Details
Closed on
Apr 5, 2005
Sold by
Wilson Frank J
Bought by
Porter Neki T
Home Financials for this Owner
Home Financials are based on the most recent Mortgage that was taken out on this home.
Original Mortgage
$119,000
Interest Rate
8.25%
Mortgage Type
New Conventional
Purchase Details
Closed on
Aug 20, 2004
Sold by
Stang Donald R
Bought by
Wilson Frank J
Purchase Details
Closed on
Jul 14, 1998
Sold by
Brown James R and Brown Joyce C
Bought by
Stang Donald R
Create a Home Valuation Report for This Property
The Home Valuation Report is an in-depth analysis detailing your home's value as well as a comparison with similar homes in the area
Purchase History
| Date | Buyer | Sale Price | Title Company |
|---|---|---|---|
| Goodrich Ryle | $109,000 | -- | |
| Goodrich Ryle | $99,250 | -- | |
| Porter Neki T | $119,000 | -- | |
| Wilson Frank J | $18,500 | -- | |
| Stang Donald R | $9,300 | -- |
Source: Public Records
Mortgage History
| Date | Status | Borrower | Loan Amount |
|---|---|---|---|
| Open | Goodrich Ryle | $87,200 | |
| Previous Owner | Porter Neki T | $119,000 |
Source: Public Records
Tax History
| Year | Tax Paid | Tax Assessment Tax Assessment Total Assessment is a certain percentage of the fair market value that is determined by local assessors to be the total taxable value of land and additions on the property. | Land | Improvement |
|---|---|---|---|---|
| 2025 | $2,862 | $92,167 | $12,000 | $80,167 |
| 2024 | $2,862 | $86,930 | $12,000 | $74,930 |
| 2023 | $2,717 | $79,155 | $12,000 | $67,155 |
| 2022 | $2,066 | $64,759 | $10,400 | $54,359 |
| 2021 | $1,914 | $56,799 | $10,400 | $46,399 |
| 2020 | $1,833 | $54,392 | $10,400 | $43,992 |
| 2019 | $1,711 | $50,395 | $8,800 | $41,595 |
| 2018 | $1,630 | $48,014 | $8,800 | $39,214 |
| 2017 | $1,533 | $45,154 | $8,800 | $36,354 |
| 2016 | $1,192 | $35,118 | $8,800 | $26,318 |
| 2015 | $1,053 | $30,976 | $8,800 | $22,176 |
| 2014 | $1,027 | $30,152 | $8,800 | $21,352 |
Source: Public Records
Map
Nearby Homes
- 370 Camelot Dr
- 395 Roberts Rd
- 355 Camelot Dr
- 265 Round Table Rd
- 395 Round Table Rd
- 135 Partridge Ln
- 140 Merlin Dr
- 154 Mcleroy Dr
- 300 Lavender Rd
- 210 Lavender Rd
- 533 Edgewood Dr
- 247 Jasmine Trail
- 265 Federal St
- 245 Federal St
- 309 Jasmine Trail
- 100 Whitehead Terrace E
- 325 Edgewood Dr
- 584 Edgewood Dr
- 185 Boundary St
- 150 Whitehead Terrace E
- 340 Roberts Rd
- 320 Roberts Rd
- 888 Horizon Blvd
- 135 Round Table Rd
- 360 Roberts Rd
- 335 Roberts Rd
- 345 Roberts Rd
- 300 Roberts Rd
- 370 Roberts Rd
- 355 Roberts Rd
- 325 Roberts Rd
- 165 Round Table Rd
- 365 Roberts Rd
- 165 Round Table Ct
- 160 Round Table Rd
- 380 Roberts Rd
- 315 Roberts Rd
- 280 Roberts Rd
- 340 Camelot Dr
- 350 Camelot Dr
Your Personal Tour Guide
Ask me questions while you tour the home.