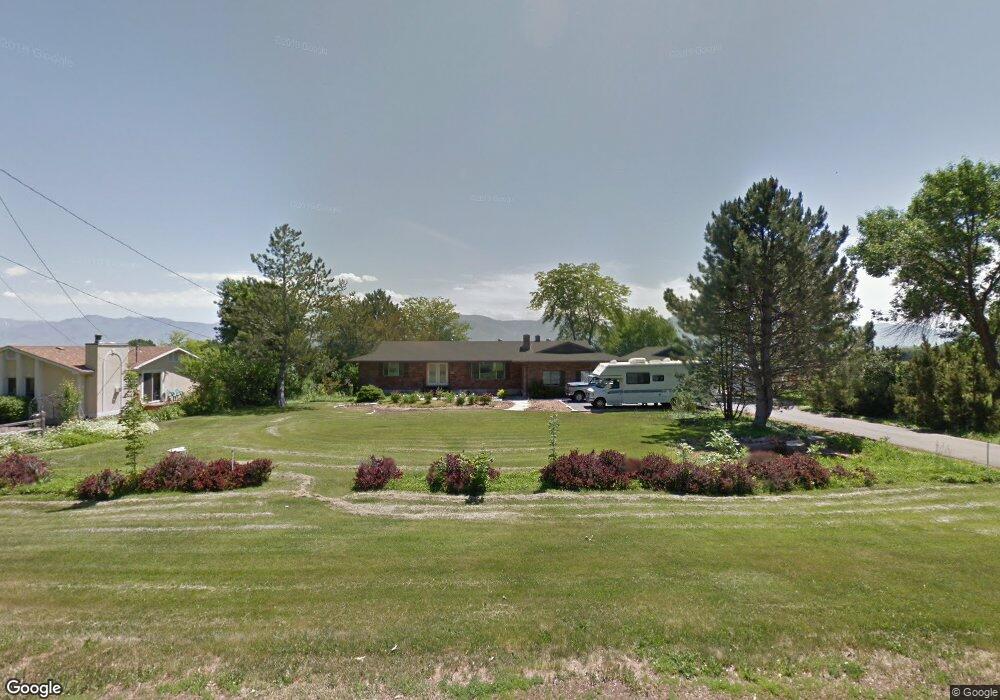
330 S 100 E Mendon, UT 84325
Estimated Value: $487,000 - $741,000
Studio
--
Bath
1,392
Sq Ft
$424/Sq Ft
Est. Value
About This Home
This home is located at 330 S 100 E, Mendon, UT 84325 and is currently estimated at $590,429, approximately $424 per square foot. 330 S 100 E is a home with nearby schools including Mountainside School, South Cache Middle School, and Mountain Crest High School.
Ownership History
Date
Name
Owned For
Owner Type
Purchase Details
Closed on
Aug 15, 2008
Sold by
Peterson Robert H and Peterson Lorraine E
Bought by
Brown James R and Brown Marianne
Current Estimated Value
Home Financials for this Owner
Home Financials are based on the most recent Mortgage that was taken out on this home.
Original Mortgage
$70,000
Interest Rate
6.37%
Mortgage Type
New Conventional
Purchase Details
Closed on
Aug 1, 2002
Sold by
Wardle Jay V
Bought by
Peterson Robert H and Peterson Lorraine E
Create a Home Valuation Report for This Property
The Home Valuation Report is an in-depth analysis detailing your home's value as well as a comparison with similar homes in the area
Purchase History
| Date | Buyer | Sale Price | Title Company |
|---|---|---|---|
| Brown James R | -- | Pinnacle Title Ins Agency | |
| Peterson Robert H | -- | -- |
Source: Public Records
Mortgage History
| Date | Status | Borrower | Loan Amount |
|---|---|---|---|
| Closed | Brown James R | $70,000 |
Source: Public Records
Tax History
| Year | Tax Paid | Tax Assessment Tax Assessment Total Assessment is a certain percentage of the fair market value that is determined by local assessors to be the total taxable value of land and additions on the property. | Land | Improvement |
|---|---|---|---|---|
| 2025 | $209 | $276,475 | $0 | $0 |
| 2024 | $2,229 | $276,475 | $0 | $0 |
| 2023 | $2,181 | $257,005 | $0 | $0 |
| 2022 | $2,196 | $257,005 | $0 | $0 |
| 2021 | $1,856 | $326,180 | $57,500 | $268,680 |
| 2020 | $1,730 | $281,400 | $57,500 | $223,900 |
| 2019 | $1,692 | $261,158 | $57,500 | $203,658 |
| 2018 | $1,496 | $230,092 | $57,500 | $172,592 |
| 2017 | $1,444 | $116,380 | $0 | $0 |
| 2016 | $1,428 | $109,505 | $0 | $0 |
| 2015 | $1,353 | $109,505 | $0 | $0 |
| 2014 | $1,179 | $97,745 | $0 | $0 |
| 2013 | -- | $97,745 | $0 | $0 |
Source: Public Records
Map
Nearby Homes
- 1811 S 5900 W
- 54 W 200 N
- 2500 S 6400 W
- 6770 W 400 S
- 4700 W 2900 S
- 5624 W 3400 S
- 876 N 75 W Unit 9
- 967 N 75 W Unit 63
- 59 W 1050 N Unit 18
- 993 N 75 W Unit 64
- 948 N 75 W Unit 11
- 42 W 850 N Unit 5
- 1044 N 75 W Unit 15
- 850 N 51 W Unit 59
- 74 W 850 N Unit 7
- 915 N 75 W Unit 61
- 850 N 73 W Unit 60
- 26 W 850 N Unit 4
- 1045 N 75 W Unit 66
- 1052 N 75 W Unit 16
Your Personal Tour Guide
Ask me questions while you tour the home.