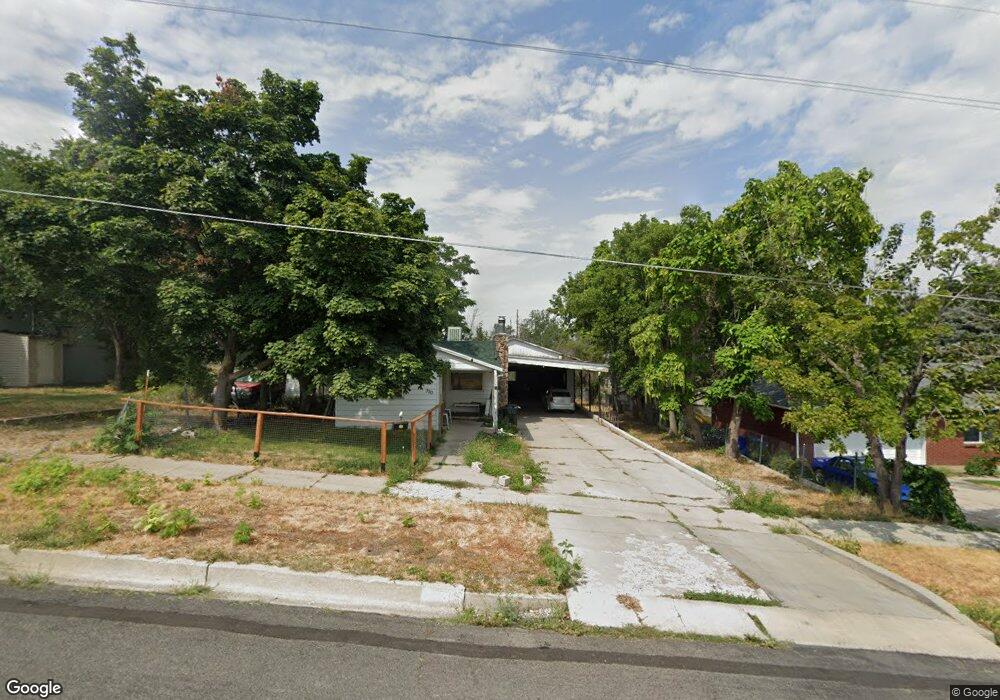
330 S 100 E Tooele, UT 84074
Estimated Value: $292,000 - $317,000
3
Beds
1
Bath
1,536
Sq Ft
$200/Sq Ft
Est. Value
About This Home
This home is located at 330 S 100 E, Tooele, UT 84074 and is currently estimated at $306,499, approximately $199 per square foot. 330 S 100 E is a home located in Tooele County with nearby schools including Sterling Elementary School, Tooele Junior High School, and Tooele High School.
Ownership History
Date
Name
Owned For
Owner Type
Purchase Details
Closed on
Jan 18, 2021
Sold by
Brown Douglas W and Estate Of Robert Lamar Brown
Bought by
Brown Douglas W
Current Estimated Value
Create a Home Valuation Report for This Property
The Home Valuation Report is an in-depth analysis detailing your home's value as well as a comparison with similar homes in the area
Purchase History
| Date | Buyer | Sale Price | Title Company |
|---|---|---|---|
| Brown Douglas W | -- | None Available |
Source: Public Records
Tax History
| Year | Tax Paid | Tax Assessment Tax Assessment Total Assessment is a certain percentage of the fair market value that is determined by local assessors to be the total taxable value of land and additions on the property. | Land | Improvement |
|---|---|---|---|---|
| 2025 | $1,592 | $241,365 | $103,950 | $137,415 |
| 2024 | $1,781 | $135,934 | $57,173 | $78,761 |
| 2023 | $1,781 | $143,411 | $56,100 | $87,311 |
| 2022 | $2,338 | $201,147 | $78,203 | $122,944 |
| 2021 | $1,801 | $129,636 | $31,281 | $98,355 |
| 2020 | $1,758 | $219,445 | $56,875 | $162,570 |
| 2019 | $1,614 | $198,240 | $56,875 | $141,365 |
| 2018 | $1,349 | $157,095 | $50,000 | $107,095 |
| 2017 | $1,118 | $154,450 | $41,625 | $112,825 |
| 2016 | $951 | $76,854 | $22,894 | $53,960 |
| 2015 | $951 | $69,180 | $0 | $0 |
| 2014 | -- | $69,180 | $0 | $0 |
Source: Public Records
Map
Nearby Homes
- 220 S Main St
- 422 S Main St
- 156 S 200 E
- 179 S 179 S 200 E
- 354 S 100 W
- 543 S 50 W Unit 14
- 299 Sage Cir
- 1757 N Patchwork Ave Unit 1262
- 1763 N Patchwork Ave Unit 1260
- 274 Upland Dr
- 175 E Vine St
- 599 Canyon Rd
- 197 W 100 S
- 598 Canyon Rd
- 268 E Vine St
- 47 S 3rd St
- 375 Fairlane Dr
- 364 Fairlane Dr
- 468 Pioneer Ave
- 106 N 1st St
Your Personal Tour Guide
Ask me questions while you tour the home.