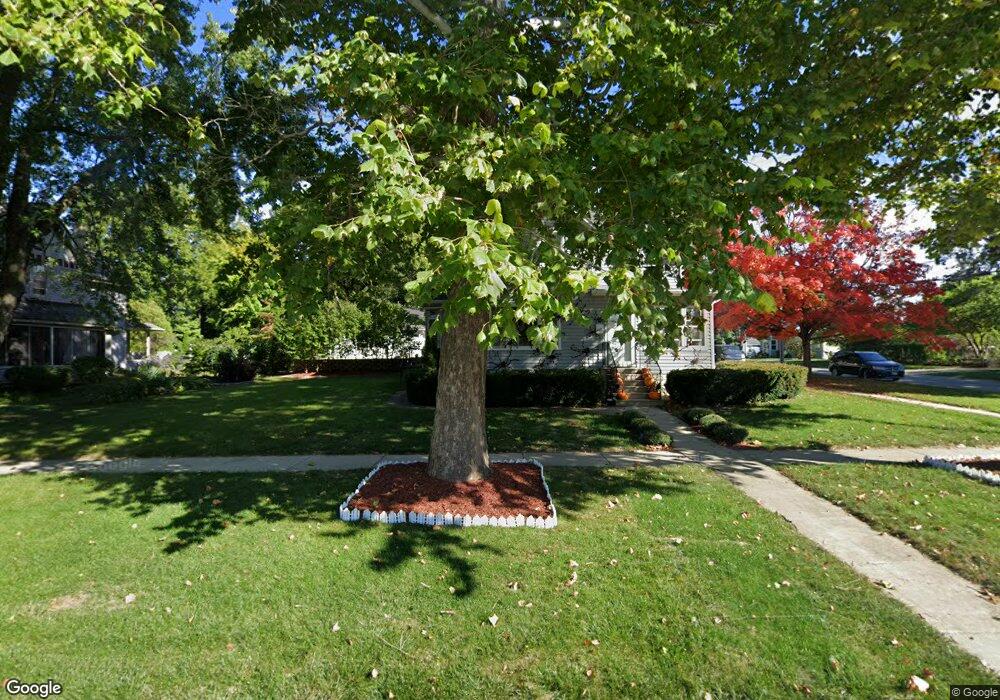
330 S Main St Sycamore, IL 60178
Estimated Value: $300,000 - $327,000
3
Beds
2
Baths
2,500
Sq Ft
$126/Sq Ft
Est. Value
About This Home
This home is located at 330 S Main St, Sycamore, IL 60178 and is currently estimated at $314,127, approximately $125 per square foot. 330 S Main St is a home located in DeKalb County with nearby schools including Sycamore High School, St Mary's Catholic School, and Cornerstone Christian Academy.
Ownership History
Date
Name
Owned For
Owner Type
Purchase Details
Closed on
Apr 13, 2007
Sold by
Moore Benjamin S
Bought by
Gable Earl C
Current Estimated Value
Home Financials for this Owner
Home Financials are based on the most recent Mortgage that was taken out on this home.
Original Mortgage
$180,000
Outstanding Balance
$109,132
Interest Rate
6.2%
Mortgage Type
New Conventional
Estimated Equity
$204,995
Create a Home Valuation Report for This Property
The Home Valuation Report is an in-depth analysis detailing your home's value as well as a comparison with similar homes in the area
Home Values in the Area
Average Home Value in this Area
Purchase History
| Date | Buyer | Sale Price | Title Company |
|---|---|---|---|
| Gable Earl C | $222,000 | -- |
Source: Public Records
Mortgage History
| Date | Status | Borrower | Loan Amount |
|---|---|---|---|
| Open | Gable Earl C | $180,000 |
Source: Public Records
Tax History
| Year | Tax Paid | Tax Assessment Tax Assessment Total Assessment is a certain percentage of the fair market value that is determined by local assessors to be the total taxable value of land and additions on the property. | Land | Improvement |
|---|---|---|---|---|
| 2024 | $6,811 | $89,023 | $16,985 | $72,038 |
| 2023 | $6,811 | $81,292 | $15,510 | $65,782 |
| 2022 | $6,497 | $74,559 | $14,225 | $60,334 |
| 2021 | $6,174 | $69,995 | $13,354 | $56,641 |
| 2020 | $6,085 | $68,275 | $13,026 | $55,249 |
| 2019 | $5,982 | $66,780 | $12,741 | $54,039 |
| 2018 | $5,875 | $64,753 | $12,354 | $52,399 |
| 2017 | $5,724 | $62,191 | $11,865 | $50,326 |
| 2016 | $5,577 | $59,354 | $11,324 | $48,030 |
| 2015 | -- | $55,863 | $10,658 | $45,205 |
| 2014 | -- | $53,047 | $10,121 | $42,926 |
| 2013 | -- | $54,063 | $10,315 | $43,748 |
Source: Public Records
Map
Nearby Homes
- Lot 1 Route 23
- 405 W High St
- 356 Home St
- 401 E Lincoln St
- 1929 Galloway Ct
- 732 Park Ave
- 212 Kishwaukee Dr
- 906 Somonauk St
- 429 Fairway Ln
- 418 Fairway Ln
- 432 Fairway Ln
- 914 Nottingham Rd
- 962 Bailey Rd
- 919 Juniper Dr
- 922 Nottingham Rd
- 927 Juniper Dr
- 916 Juniper Dr
- 1008 Nottingham Rd
- 924 Juniper Dr
- 1025 Juniper Dr
Your Personal Tour Guide
Ask me questions while you tour the home.