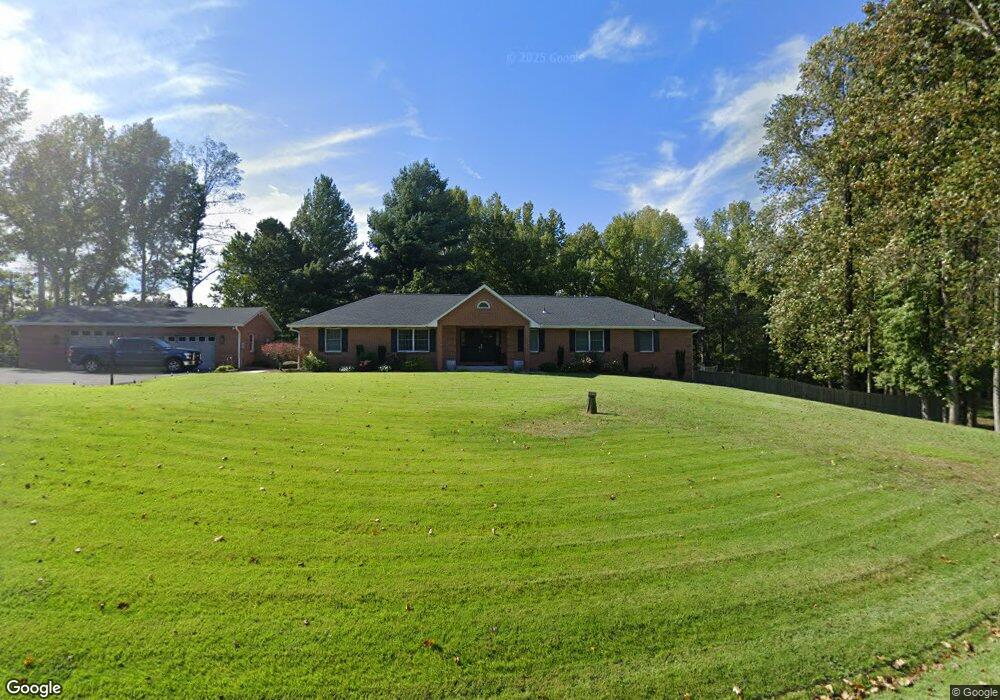
330 Sheckells Rd Huntingtown, MD 20639
Estimated Value: $610,000 - $712,000
4
Beds
3
Baths
3,585
Sq Ft
$190/Sq Ft
Est. Value
About This Home
This home is located at 330 Sheckells Rd, Huntingtown, MD 20639 and is currently estimated at $682,097, approximately $190 per square foot. 330 Sheckells Rd is a home located in Calvert County with nearby schools including Sunderland Elementary School, Windy Hill Middle School, and Huntingtown High School.
Ownership History
Date
Name
Owned For
Owner Type
Purchase Details
Closed on
Jun 28, 2011
Sold by
Egan Insun and Egan James J
Bought by
Rulapaugh John A and Rulapaugh Erika S
Current Estimated Value
Home Financials for this Owner
Home Financials are based on the most recent Mortgage that was taken out on this home.
Original Mortgage
$380,000
Outstanding Balance
$241,544
Interest Rate
2.96%
Mortgage Type
Adjustable Rate Mortgage/ARM
Estimated Equity
$440,553
Purchase Details
Closed on
May 26, 2011
Sold by
Egan Insun and Egan James J
Bought by
Rulapaugh John A and Rulapaugh Erika S
Home Financials for this Owner
Home Financials are based on the most recent Mortgage that was taken out on this home.
Original Mortgage
$380,000
Outstanding Balance
$241,544
Interest Rate
2.96%
Mortgage Type
Adjustable Rate Mortgage/ARM
Estimated Equity
$440,553
Purchase Details
Closed on
Nov 20, 2009
Sold by
Egan Robert J and Egan Insun
Bought by
Egan Insun and Egan James J
Create a Home Valuation Report for This Property
The Home Valuation Report is an in-depth analysis detailing your home's value as well as a comparison with similar homes in the area
Home Values in the Area
Average Home Value in this Area
Purchase History
| Date | Buyer | Sale Price | Title Company |
|---|---|---|---|
| Rulapaugh John A | $400,000 | -- | |
| Rulapaugh John A | $400,000 | -- | |
| Rulapaugh John A | $400,000 | First American Title Insuran | |
| Rulapaugh John A | $400,000 | -- | |
| Rulapaugh John A | $400,000 | -- | |
| Egan Insun | -- | -- |
Source: Public Records
Mortgage History
| Date | Status | Borrower | Loan Amount |
|---|---|---|---|
| Open | Rulapaugh John A | $380,000 | |
| Closed | Rulapaugh John A | $380,000 | |
| Closed | Rulapaugh John A | $380,000 |
Source: Public Records
Tax History Compared to Growth
Tax History
| Year | Tax Paid | Tax Assessment Tax Assessment Total Assessment is a certain percentage of the fair market value that is determined by local assessors to be the total taxable value of land and additions on the property. | Land | Improvement |
|---|---|---|---|---|
| 2025 | $5,615 | $539,367 | $0 | $0 |
| 2024 | $5,615 | $500,300 | $183,500 | $316,800 |
| 2023 | $5,173 | $477,333 | $0 | $0 |
| 2022 | $4,932 | $454,367 | $0 | $0 |
| 2021 | $4,663 | $431,400 | $183,500 | $247,900 |
| 2020 | $4,663 | $427,000 | $0 | $0 |
| 2019 | $4,635 | $422,600 | $0 | $0 |
| 2018 | $4,576 | $418,200 | $183,500 | $234,700 |
| 2017 | $4,504 | $405,833 | $0 | $0 |
| 2016 | -- | $393,467 | $0 | $0 |
| 2015 | $5,081 | $381,100 | $0 | $0 |
| 2014 | $5,081 | $381,100 | $0 | $0 |
Source: Public Records
Map
Nearby Homes
- 550 Carla Dr
- 5460 Solomons Island Rd
- 4618 Green Ridge Ct
- 360 Hoile Ln
- 140 Hoile Ln
- 215 Hoile Ln
- 1030 Stephen Reid Dr
- 124 Turnabout Ln
- 4310 Rhett Butler Ct
- 4470 Harvest Ln
- 5650 Collington Ct
- 125 Prospect Dr
- 4110 Old Town Rd
- 4585 Terri Ln
- 4090 Old Town Rd
- 694 Ponds Wood Rd
- 4021 Old Town Rd
- 1992 Smoky Rd
- 1730 Pinkneys Field Dr
- 6440 Briarwood Dr