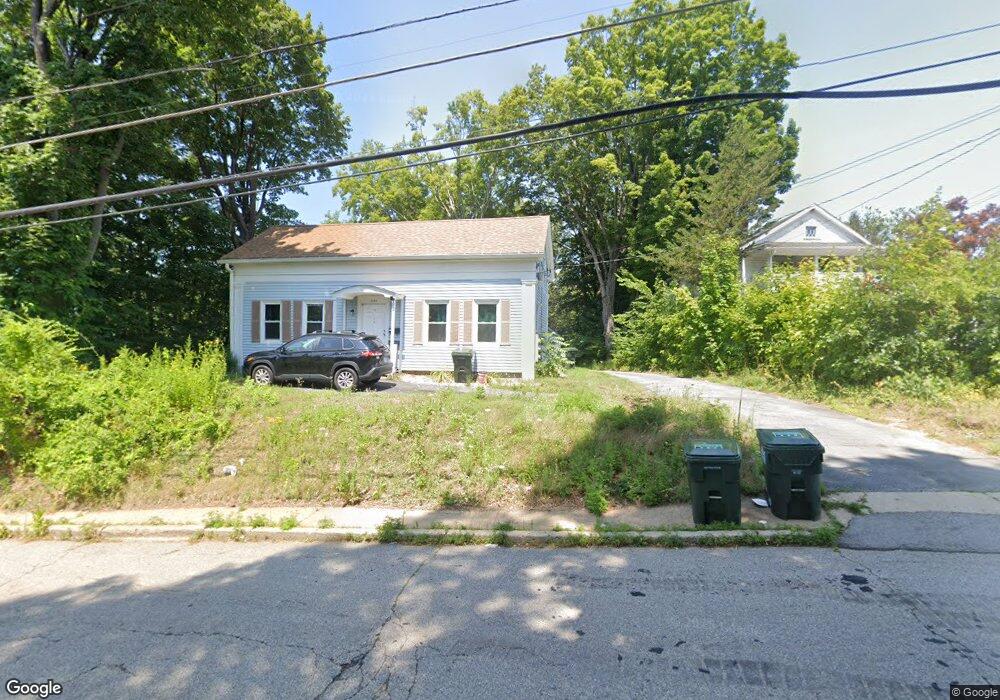
330 South St Unit 1 Southbridge, MA 01550
Estimated Value: $390,000 - $452,000
2
Beds
2
Baths
600
Sq Ft
$688/Sq Ft
Est. Value
About This Home
This home is located at 330 South St Unit 1, Southbridge, MA 01550 and is currently estimated at $412,747, approximately $687 per square foot. 330 South St Unit 1 is a home located in Worcester County with nearby schools including Trinity Catholic Academy.
Ownership History
Date
Name
Owned For
Owner Type
Purchase Details
Closed on
May 2, 2003
Sold by
Forrester William E and Forrester Alice H
Bought by
Grant Charles F and Ouellette Jill A
Current Estimated Value
Home Financials for this Owner
Home Financials are based on the most recent Mortgage that was taken out on this home.
Original Mortgage
$217,550
Outstanding Balance
$94,758
Interest Rate
5.82%
Mortgage Type
Purchase Money Mortgage
Estimated Equity
$317,989
Create a Home Valuation Report for This Property
The Home Valuation Report is an in-depth analysis detailing your home's value as well as a comparison with similar homes in the area
Home Values in the Area
Average Home Value in this Area
Purchase History
| Date | Buyer | Sale Price | Title Company |
|---|---|---|---|
| Grant Charles F | $229,000 | -- | |
| Grant Charles F | $229,000 | -- |
Source: Public Records
Mortgage History
| Date | Status | Borrower | Loan Amount |
|---|---|---|---|
| Open | Grant Charles F | $217,550 |
Source: Public Records
Tax History Compared to Growth
Tax History
| Year | Tax Paid | Tax Assessment Tax Assessment Total Assessment is a certain percentage of the fair market value that is determined by local assessors to be the total taxable value of land and additions on the property. | Land | Improvement |
|---|---|---|---|---|
| 2025 | $5,121 | $349,300 | $43,700 | $305,600 |
| 2024 | $4,818 | $315,700 | $36,400 | $279,300 |
| 2023 | $4,535 | $286,300 | $36,400 | $249,900 |
| 2022 | $4,291 | $239,700 | $31,000 | $208,700 |
| 2021 | $4,059 | $208,800 | $31,000 | $177,800 |
| 2020 | $3,822 | $196,200 | $31,000 | $165,200 |
| 2018 | $3,494 | $175,100 | $31,000 | $144,100 |
| 2017 | $3,341 | $162,400 | $31,000 | $131,400 |
| 2016 | $3,282 | $162,400 | $31,000 | $131,400 |
| 2015 | $3,306 | $162,400 | $31,000 | $131,400 |
| 2014 | $3,190 | $162,400 | $31,000 | $131,400 |
Source: Public Records
Map
Nearby Homes