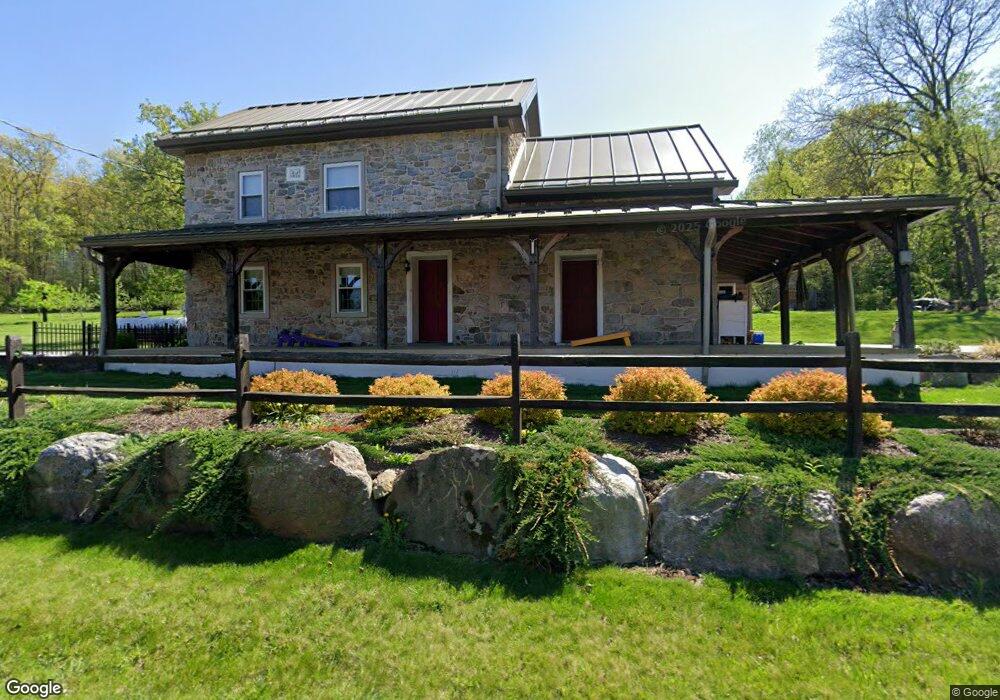
330 Swamp Rd Morgantown, PA 19543
Estimated Value: $458,524 - $769,000
6
Beds
3
Baths
4,060
Sq Ft
$145/Sq Ft
Est. Value
About This Home
This home is located at 330 Swamp Rd, Morgantown, PA 19543 and is currently estimated at $588,631, approximately $144 per square foot. 330 Swamp Rd is a home located in Berks County with nearby schools including Robeson Elementary Center, Twin Valley Middle School, and Twin Valley High School.
Ownership History
Date
Name
Owned For
Owner Type
Purchase Details
Closed on
Jan 12, 2024
Sold by
Glick Emanuel S and Glick Sarah E
Bought by
J-Mer Properties Llc
Current Estimated Value
Home Financials for this Owner
Home Financials are based on the most recent Mortgage that was taken out on this home.
Original Mortgage
$640,000
Outstanding Balance
$628,969
Interest Rate
7.03%
Mortgage Type
New Conventional
Estimated Equity
-$40,338
Purchase Details
Closed on
Jun 14, 2014
Sold by
Hammond Mark W
Bought by
Glick Emanuel S and Glick Sarah E
Home Financials for this Owner
Home Financials are based on the most recent Mortgage that was taken out on this home.
Original Mortgage
$180,000
Interest Rate
4.27%
Mortgage Type
Construction
Purchase Details
Closed on
Aug 7, 2006
Sold by
Stoltzfus D Lynn and Stoltzfus Wendy S
Bought by
Hammond Mark
Create a Home Valuation Report for This Property
The Home Valuation Report is an in-depth analysis detailing your home's value as well as a comparison with similar homes in the area
Home Values in the Area
Average Home Value in this Area
Purchase History
| Date | Buyer | Sale Price | Title Company |
|---|---|---|---|
| J-Mer Properties Llc | $800,000 | None Listed On Document | |
| Glick Emanuel S | $225,000 | Non Available | |
| Hammond Mark | $250,000 | None Available |
Source: Public Records
Mortgage History
| Date | Status | Borrower | Loan Amount |
|---|---|---|---|
| Open | J-Mer Properties Llc | $640,000 | |
| Previous Owner | Glick Emanuel S | $180,000 |
Source: Public Records
Tax History Compared to Growth
Tax History
| Year | Tax Paid | Tax Assessment Tax Assessment Total Assessment is a certain percentage of the fair market value that is determined by local assessors to be the total taxable value of land and additions on the property. | Land | Improvement |
|---|---|---|---|---|
| 2025 | $1,609 | $130,900 | $48,100 | $82,800 |
| 2024 | $5,122 | $130,900 | $48,100 | $82,800 |
| 2023 | $5,126 | $130,900 | $48,100 | $82,800 |
| 2022 | $5,001 | $130,900 | $48,100 | $82,800 |
| 2021 | $4,848 | $130,900 | $48,100 | $82,800 |
| 2020 | $4,935 | $130,900 | $48,100 | $82,800 |
| 2019 | $4,933 | $130,900 | $48,100 | $82,800 |
| 2018 | $4,933 | $130,900 | $48,100 | $82,800 |
| 2017 | $4,794 | $130,900 | $48,100 | $82,800 |
| 2016 | $1,055 | $130,900 | $48,100 | $82,800 |
| 2015 | $1,055 | $109,300 | $48,100 | $61,200 |
| 2014 | $1,055 | $109,300 | $48,100 | $61,200 |
Source: Public Records
Map
Nearby Homes
- 3511 Main St
- 112 Maxwell Hill Rd
- 1520 Lexington Way
- 20 Broad ax Pass
- 102 Country Ln
- 24 Wexford Ct
- 44 Wexford Ct
- 80 Trappers Run
- 0 Heritage Dr Unit 4A PABK2058798
- 1 Senn Ln
- 0 Laurel Rd
- 2287 Laurel Rd
- 2085 Main St
- 601 Briarwood Dr
- 52 W Main St
- 28 W Main St
- 59 E Main St
- 0 Westbrook Dr
- 0 Westbrook Dr
- 0 Westbrook Dr