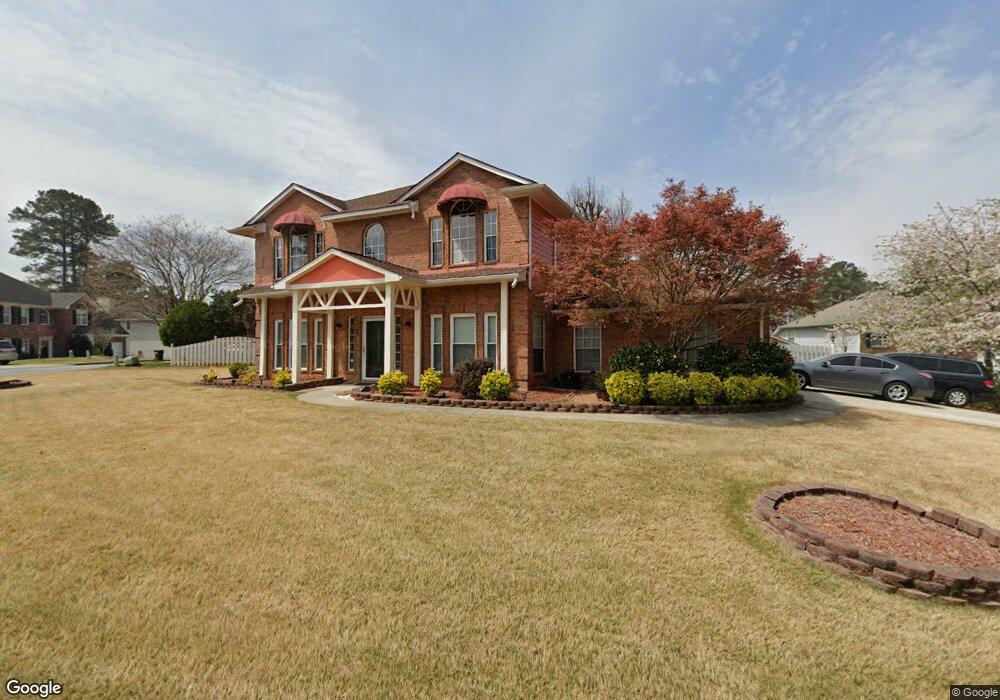
330 Tanners Crossing Unit 3 Alpharetta, GA 30022
Estimated Value: $602,000 - $641,000
4
Beds
3
Baths
2,584
Sq Ft
$238/Sq Ft
Est. Value
About This Home
This home is located at 330 Tanners Crossing Unit 3, Alpharetta, GA 30022 and is currently estimated at $614,004, approximately $237 per square foot. 330 Tanners Crossing Unit 3 is a home located in Fulton County with nearby schools including State Bridge Crossing Elementary School, Taylor Road Middle School, and Chattahoochee High School.
Ownership History
Date
Name
Owned For
Owner Type
Purchase Details
Closed on
Mar 22, 2004
Sold by
Seu Timothy K
Bought by
Huang Chung L
Current Estimated Value
Home Financials for this Owner
Home Financials are based on the most recent Mortgage that was taken out on this home.
Original Mortgage
$161,000
Outstanding Balance
$80,882
Interest Rate
6.75%
Mortgage Type
New Conventional
Estimated Equity
$533,122
Purchase Details
Closed on
Jun 19, 2001
Sold by
Patel Yatin N and Patel Deval Y
Bought by
Seu Timothy K
Home Financials for this Owner
Home Financials are based on the most recent Mortgage that was taken out on this home.
Original Mortgage
$171,950
Interest Rate
7.17%
Mortgage Type
New Conventional
Purchase Details
Closed on
Dec 28, 1993
Sold by
Dudley C Michael
Bought by
Cooper Michael W
Home Financials for this Owner
Home Financials are based on the most recent Mortgage that was taken out on this home.
Original Mortgage
$111,150
Interest Rate
7.1%
Create a Home Valuation Report for This Property
The Home Valuation Report is an in-depth analysis detailing your home's value as well as a comparison with similar homes in the area
Home Values in the Area
Average Home Value in this Area
Purchase History
| Date | Buyer | Sale Price | Title Company |
|---|---|---|---|
| Huang Chung L | $179,000 | -- | |
| Seu Timothy K | $181,000 | -- | |
| Cooper Michael W | $123,600 | -- |
Source: Public Records
Mortgage History
| Date | Status | Borrower | Loan Amount |
|---|---|---|---|
| Open | Huang Chung L | $161,000 | |
| Previous Owner | Seu Timothy K | $171,950 | |
| Previous Owner | Cooper Michael W | $111,150 |
Source: Public Records
Tax History Compared to Growth
Tax History
| Year | Tax Paid | Tax Assessment Tax Assessment Total Assessment is a certain percentage of the fair market value that is determined by local assessors to be the total taxable value of land and additions on the property. | Land | Improvement |
|---|---|---|---|---|
| 2025 | $2,930 | $249,640 | $56,480 | $193,160 |
| 2023 | $5,536 | $196,120 | $45,800 | $150,320 |
| 2022 | $2,796 | $155,600 | $48,360 | $107,240 |
| 2021 | $2,763 | $136,480 | $39,960 | $96,520 |
| 2020 | $2,779 | $134,840 | $39,480 | $95,360 |
| 2019 | $340 | $132,480 | $38,800 | $93,680 |
| 2018 | $3,016 | $110,200 | $27,120 | $83,080 |
| 2017 | $2,717 | $92,320 | $18,680 | $73,640 |
| 2016 | $2,565 | $92,320 | $18,680 | $73,640 |
| 2015 | $2,385 | $83,480 | $18,680 | $64,800 |
| 2014 | $2,033 | $70,680 | $15,800 | $54,880 |
Source: Public Records
Map
Nearby Homes
- 5022 Anclote Dr
- 4965 Cinnabar Dr
- 10840 Mortons Crossing
- 225 Morton Creek Cir
- 5060 Cinnabar Dr
- 220 Magnolia Tree Ct
- 120 Donamere Ct
- 465 Mikasa Dr
- 10906 Gallier St
- 425 Mikasa Dr
- 4965 N Bridges Dr
- 230 Pinebridge Ct
- 165 Morton Walk Dr Unit 1
- 4740 Carversham Way
- 130 Douglas Fir Ct Unit 1
- 11125 Linbrook Ln
- 4790 Roswell Mill Dr
- 6365 Murets Rd
- 4645 Valais Ct Unit 109
- 11390 Ridge Hill Dr
- 320 Tanners Crossing
- 340 Tanners Crossing
- 310 Tanners Crossing
- 385 Tanners Crossing
- 0 Tanners Crossing Unit 3253018
- 0 Tanners Crossing Unit 8727450
- 0 Tanners Crossing Unit 8561498
- 0 Tanners Crossing Unit 8456922
- 0 Tanners Crossing Unit 8412009
- 0 Tanners Crossing
- 395 Tanners Crossing
- 345 Tanners Crossing
- 335 Tanners Crossing
- 375 Tanners Crossing
- 11075 Taylors Spring Place
- 300 Tanners Crossing
- 325 Tanners Crossing Unit III
- 350 Tanners Crossing
- 355 Tanners Crossing
- 405 Tanners Crossing