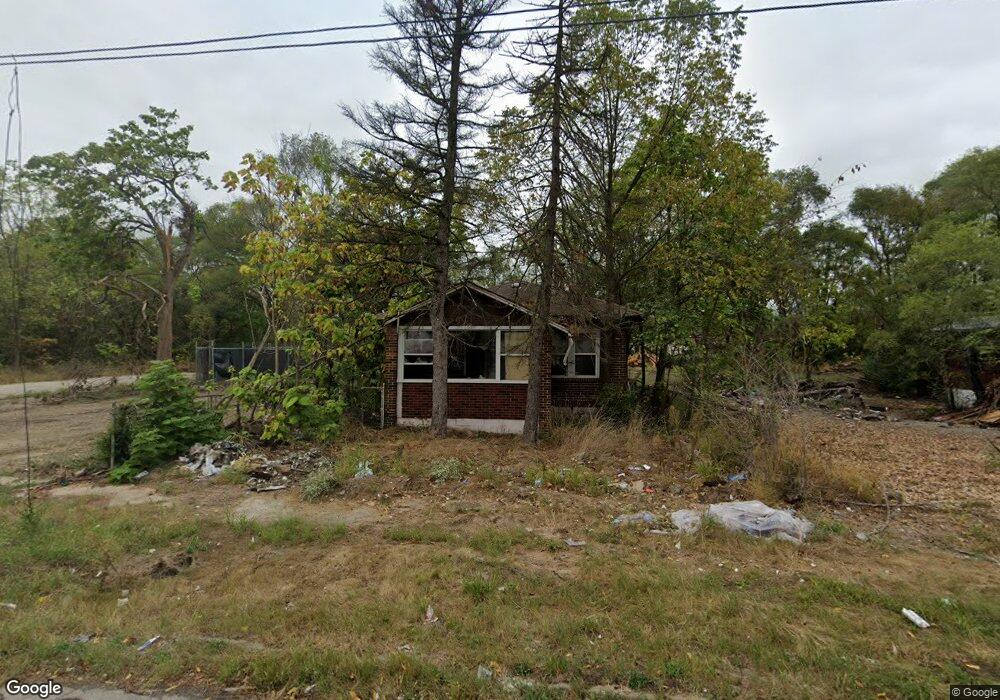
330 W 41st Ave Gary, IN 46408
Glen Park NeighborhoodEstimated Value: $52,572 - $109,000
2
Beds
1
Bath
912
Sq Ft
$94/Sq Ft
Est. Value
About This Home
This home is located at 330 W 41st Ave, Gary, IN 46408 and is currently estimated at $85,893, approximately $94 per square foot. 330 W 41st Ave is a home located in Lake County with nearby schools including Glen Park Academy for Excellence in Learning, Bailly Preparatory Academy, and West Side Leadership Academy.
Ownership History
Date
Name
Owned For
Owner Type
Purchase Details
Closed on
Jun 13, 2009
Sold by
Global Capital Holdings Llc
Bought by
Innomax Solutions Llc
Current Estimated Value
Purchase Details
Closed on
Jan 12, 2009
Sold by
Rad Properties Llc
Bought by
Global Capital Holdings Llc
Purchase Details
Closed on
Dec 17, 2007
Sold by
Destiny Ventures Llc
Bought by
Rad Properties Llc
Purchase Details
Closed on
Nov 13, 2007
Sold by
Lasalle Bank National Association
Bought by
Destiny Ventures Llc
Purchase Details
Closed on
Jun 30, 2005
Sold by
Young Clifford Ray
Bought by
Smith Dorwynn G and Smith Florence
Home Financials for this Owner
Home Financials are based on the most recent Mortgage that was taken out on this home.
Original Mortgage
$58,500
Interest Rate
7.9%
Mortgage Type
Fannie Mae Freddie Mac
Create a Home Valuation Report for This Property
The Home Valuation Report is an in-depth analysis detailing your home's value as well as a comparison with similar homes in the area
Home Values in the Area
Average Home Value in this Area
Purchase History
| Date | Buyer | Sale Price | Title Company |
|---|---|---|---|
| Innomax Solutions Llc | $9,000 | None Available | |
| Global Capital Holdings Llc | -- | None Available | |
| Rad Properties Llc | $5,000 | Indiana Title Network Compan | |
| Destiny Ventures Llc | $4,000 | Indiana Title Network Compan | |
| Smith Dorwynn G | -- | Enterprise Title Inc |
Source: Public Records
Mortgage History
| Date | Status | Borrower | Loan Amount |
|---|---|---|---|
| Previous Owner | Smith Dorwynn G | $58,500 |
Source: Public Records
Tax History
| Year | Tax Paid | Tax Assessment Tax Assessment Total Assessment is a certain percentage of the fair market value that is determined by local assessors to be the total taxable value of land and additions on the property. | Land | Improvement |
|---|---|---|---|---|
| 2025 | $2,955 | $9,200 | $4,100 | $5,100 |
| 2024 | $794 | $9,300 | $4,800 | $4,500 |
| 2023 | $146 | $9,000 | $4,800 | $4,200 |
| 2022 | $146 | $5,700 | $1,800 | $3,900 |
| 2021 | $138 | $5,400 | $1,800 | $3,600 |
| 2020 | $553 | $21,600 | $1,800 | $19,800 |
| 2019 | $1,997 | $24,600 | $2,000 | $22,600 |
| 2018 | $1,809 | $26,300 | $2,100 | $24,200 |
| 2017 | $575 | $26,600 | $2,100 | $24,500 |
| 2016 | $1,115 | $52,300 | $2,100 | $50,200 |
| 2014 | $1,240 | $53,000 | $2,700 | $50,300 |
| 2013 | $1,168 | $52,000 | $2,700 | $49,300 |
Source: Public Records
Map
Nearby Homes
- 234 W 41st Ave
- 4016 Madison St
- 4169 Monroe St
- 3992 Madison St
- 4181 Monroe St
- 3980 Madison St
- 4200 Monroe St
- 3953 Monroe St
- 4084 Broadway
- 3952-60 Broadway
- 3916 Monroe St
- 519 W 39th Ave
- 3989 Broadway
- 4521 Broadway
- 132 W 43rd Ave
- 4257 Van Buren St
- 4265 Van Buren St
- 4151 Harrison St
- 4343 Adams St
- 4217 Massachusetts St
- 324 W 41st Ave
- 336 W 41st Ave
- 318 W 41st Ave
- 312 W 41st Ave
- 321 W 41st Ave
- 306 W 41st Ave
- 329 W 41st Ave
- 300 W 41st Ave
- 309 W 41st Ave
- 4120 Madison St
- 4117 Madison St
- 301 W 41st Ave
- 4125 Madison St
- 409 W 41st Ave
- 4120 Jefferson St
- 238 W 41st Ave
- 4133 Madison St
- 4126 Jefferson St
- 4046 Madison St
- 4124 Madison St
Your Personal Tour Guide
Ask me questions while you tour the home.