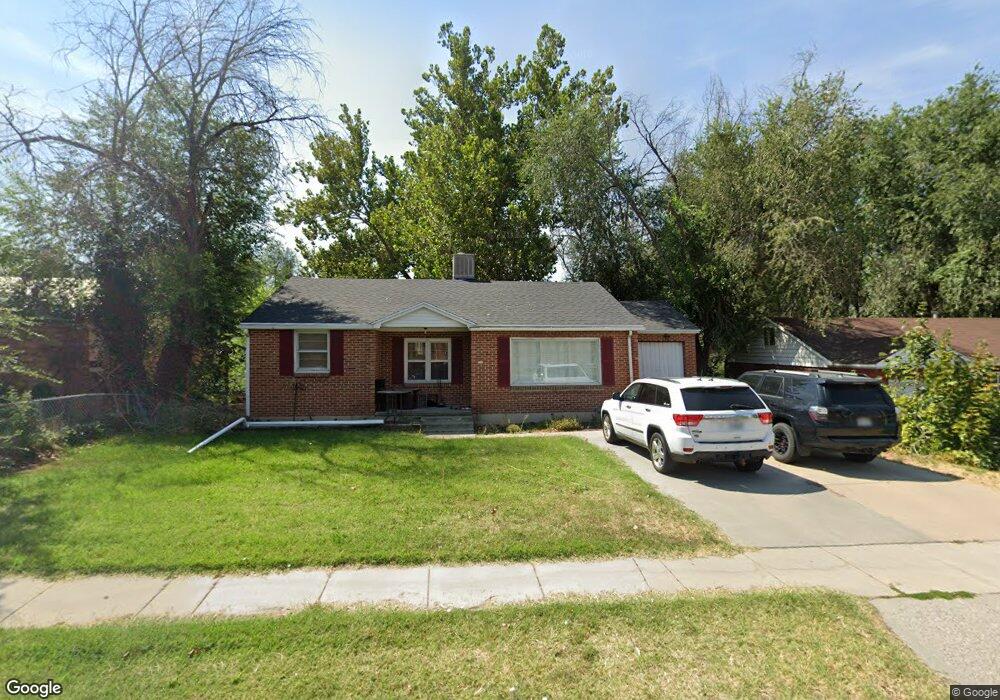
330 W Gordon Ave Layton, UT 84041
Estimated Value: $400,000 - $439,000
5
Beds
2
Baths
2,302
Sq Ft
$181/Sq Ft
Est. Value
About This Home
This home is located at 330 W Gordon Ave, Layton, UT 84041 and is currently estimated at $416,593, approximately $180 per square foot. 330 W Gordon Ave is a home located in Davis County with nearby schools including Crestview Elementary School, Central Davis Junior High School, and Layton High School.
Ownership History
Date
Name
Owned For
Owner Type
Purchase Details
Closed on
Dec 2, 2016
Sold by
Stuart Paul
Bought by
Olsen Alexis
Current Estimated Value
Purchase Details
Closed on
Feb 9, 2011
Sold by
Perez Ranulfo N and Perez Diane E
Bought by
Stuart Paul
Purchase Details
Closed on
Nov 30, 2007
Sold by
Cunningham Marc S and Cunningham Shiree D
Bought by
Stuart Paul
Purchase Details
Closed on
Sep 25, 2003
Sold by
Williamson Golda Beatrice
Bought by
Cunningham Marc and Cunningham Shiree
Home Financials for this Owner
Home Financials are based on the most recent Mortgage that was taken out on this home.
Original Mortgage
$111,999
Interest Rate
6.17%
Mortgage Type
FHA
Create a Home Valuation Report for This Property
The Home Valuation Report is an in-depth analysis detailing your home's value as well as a comparison with similar homes in the area
Home Values in the Area
Average Home Value in this Area
Purchase History
| Date | Buyer | Sale Price | Title Company |
|---|---|---|---|
| Olsen Alexis | -- | Stewart Title | |
| Stuart Paul | -- | None Available | |
| Stuart Paul | -- | Executive Title Ins Agency | |
| Cunningham Marc | -- | First American Title Co |
Source: Public Records
Mortgage History
| Date | Status | Borrower | Loan Amount |
|---|---|---|---|
| Previous Owner | Cunningham Marc | $111,999 |
Source: Public Records
Tax History Compared to Growth
Tax History
| Year | Tax Paid | Tax Assessment Tax Assessment Total Assessment is a certain percentage of the fair market value that is determined by local assessors to be the total taxable value of land and additions on the property. | Land | Improvement |
|---|---|---|---|---|
| 2025 | $1,939 | $203,500 | $68,688 | $134,812 |
| 2024 | $1,867 | $197,450 | $80,077 | $117,373 |
| 2023 | $1,872 | $349,000 | $119,472 | $229,528 |
| 2022 | $1,924 | $194,700 | $63,026 | $131,674 |
| 2021 | $1,815 | $274,000 | $88,036 | $185,964 |
| 2020 | $1,519 | $220,000 | $74,232 | $145,768 |
| 2019 | $1,474 | $209,000 | $70,646 | $138,354 |
| 2018 | $1,320 | $188,000 | $70,646 | $117,354 |
| 2016 | $1,248 | $91,685 | $26,434 | $65,251 |
| 2015 | $1,182 | $82,445 | $26,434 | $56,011 |
| 2014 | $1,131 | $80,652 | $26,434 | $54,218 |
| 2013 | -- | $73,195 | $16,544 | $56,651 |
Source: Public Records
Map
Nearby Homes
- 1096 N 300 W
- 103 W 1275 N
- 1180 N 100 E
- 1490 N 175 W
- 495 Spurlock St
- 526 King St Unit 2
- 480 Spurlock St
- 1366 N Main St Unit 5
- 441 Church St
- 324 E 1325 N
- 1583 N 25 E
- 1715 N Alder St
- 1113 W Angel Hill Ct
- 6 Grover St
- 1474 N 285 E
- 398 Paul Ave
- 1553 N 250 E
- 937 Rainbow Dr
- 1837 N 440 W
- 1677 N 1600 W Unit 134
- 342 W Gordon Ave
- 320 W Gordon Ave
- 354 W Gordon Ave
- 306 W Gordon Ave
- 325 Barbara St
- 335 Barbara St
- 343 W Barbara Ave St N Unit 4
- 309 Barbara St
- 343 Barbara St
- 368 W Gordon Ave
- 296 W Gordon Ave
- 355 Barbara St
- 291 Barbara St
- 369 W Gordon Ave
- 347 W Gordon Ave
- 369 Barbara St
- 282 W Gordon Ave
- 348 W 1050 N
- 340 W 1050 N
- 281 Barbara St