330 Westview Ave Hubbard, OH 44425
Estimated Value: $205,000 - $236,000
3
Beds
2
Baths
1,588
Sq Ft
$138/Sq Ft
Est. Value
About This Home
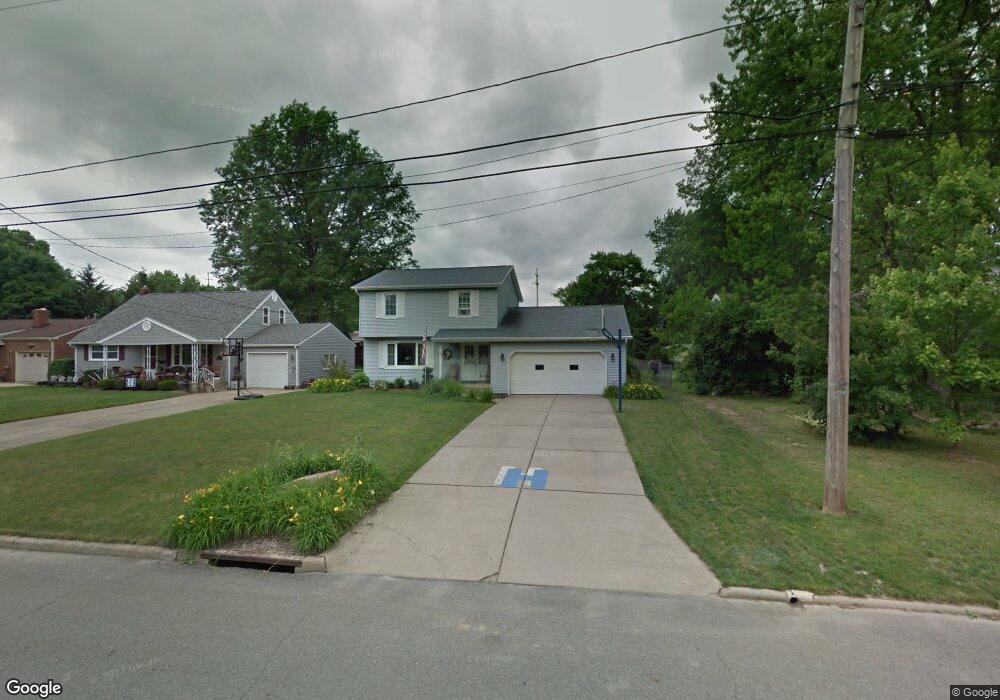
This home is located at 330 Westview Ave, Hubbard, OH 44425 and is currently estimated at $218,490, approximately $137 per square foot. 330 Westview Ave is a home located in Trumbull County with nearby schools including Hubbard Elementary School, Hubbard Middle School, and Hubbard High School.
Ownership History
Date
Name
Owned For
Owner Type
Purchase Details
Closed on
Jan 1, 1990
Bought by
Gerald Cinicola
Current Estimated Value
Create a Home Valuation Report for This Property
The Home Valuation Report is an in-depth analysis detailing your home's value as well as a comparison with similar homes in the area
Home Values in the Area
Average Home Value in this Area
Purchase History
| Date | Buyer | Sale Price | Title Company |
|---|---|---|---|
| Gerald Cinicola | -- | -- |
Source: Public Records
Tax History
| Year | Tax Paid | Tax Assessment Tax Assessment Total Assessment is a certain percentage of the fair market value that is determined by local assessors to be the total taxable value of land and additions on the property. | Land | Improvement |
|---|---|---|---|---|
| 2024 | $2,453 | $60,340 | $6,300 | $54,040 |
| 2023 | $2,953 | $60,340 | $6,300 | $54,040 |
| 2022 | $2,399 | $44,660 | $5,040 | $39,620 |
| 2021 | $2,410 | $44,660 | $5,040 | $39,620 |
| 2020 | $2,421 | $44,660 | $5,040 | $39,620 |
| 2019 | $2,184 | $38,610 | $5,040 | $33,570 |
| 2018 | $2,176 | $38,610 | $5,040 | $33,570 |
| 2017 | $1,901 | $33,920 | $5,040 | $28,880 |
| 2016 | $1,706 | $32,380 | $5,710 | $26,670 |
| 2015 | $1,713 | $32,380 | $5,710 | $26,670 |
| 2014 | $1,674 | $32,380 | $5,710 | $26,670 |
| 2013 | $1,671 | $32,380 | $5,710 | $26,670 |
Source: Public Records
Map
Nearby Homes
- 366 Westview Ave
- 269 Westview Ave
- 229 Jacobs Rd
- 665 Wendemere Dr
- 365 Scott St
- 601 Wendemere Dr
- 585 Creekside Dr
- 836 School St
- 3578 Homewood Ave
- 228 Stewart St
- V/L Jacobs Rd
- 327 W Park Ave
- 2915 Megan Cir
- 114 Oakdale Ave
- 764 Jones St
- 1720 Jacobs Rd
- 132 Drummond Ave
- 3302 Castalia Ave
- 2508 Applegate Rd
- 2675 Seifert-Lewis Rd
- 340 Westview Ave
- 322 Westview Ave
- 348 Westview Ave
- 312 Westview Ave
- 331 Jacobs Rd
- 349 Jacobs Rd
- 313 Jacobs Rd
- 356 Westview Ave
- 304 Westview Ave
- 331 Westview Ave
- 321 Westview Ave
- 341 Westview Ave
- 305 Westview Ave
- 349 Westview Ave
- 357 Jacobs Rd
- 305 Jacobs Rd
- 0 Jacobs Rd Unit 3749272
- 357 Westview Ave
- 301 Westview Ave
- 367 Jacobs Rd
Your Personal Tour Guide
Ask me questions while you tour the home.