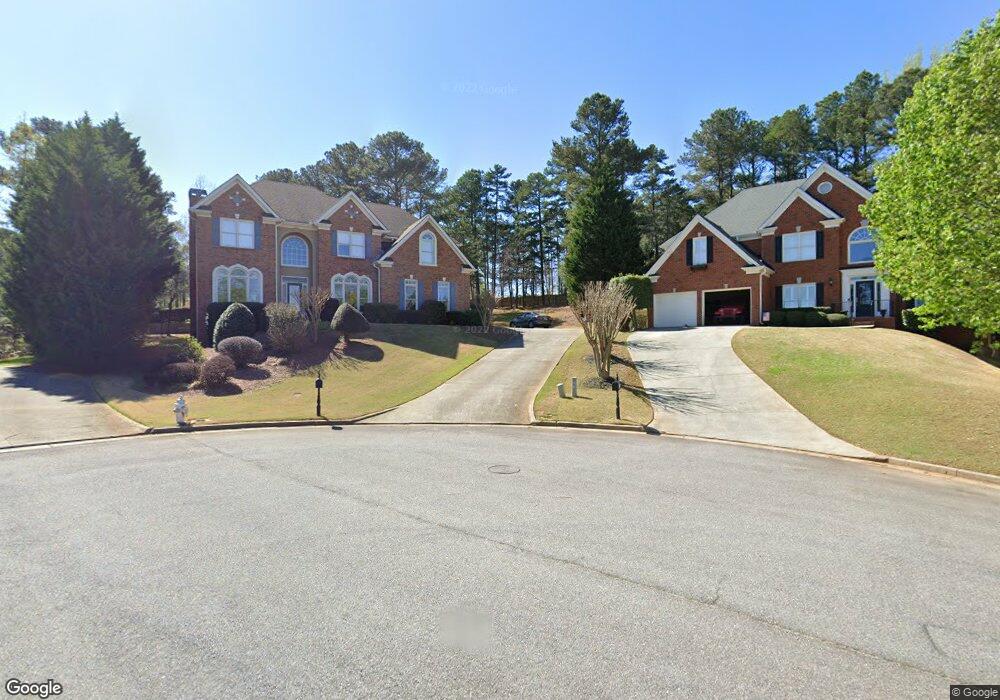
330 Willow Oak Ct Unit 8 Alpharetta, GA 30005
Seven Oaks NeighborhoodEstimated Value: $856,000 - $979,000
5
Beds
5
Baths
3,318
Sq Ft
$271/Sq Ft
Est. Value
About This Home
This home is located at 330 Willow Oak Ct Unit 8, Alpharetta, GA 30005 and is currently estimated at $900,096, approximately $271 per square foot. 330 Willow Oak Ct Unit 8 is a home located in Fulton County with nearby schools including River Trail Middle School, Northview High School, and McGinnis Woods School.
Ownership History
Date
Name
Owned For
Owner Type
Purchase Details
Closed on
Oct 29, 2020
Sold by
Taylor Colin Michael
Bought by
Mugalikar Ambarish
Current Estimated Value
Home Financials for this Owner
Home Financials are based on the most recent Mortgage that was taken out on this home.
Original Mortgage
$459,000
Outstanding Balance
$406,086
Interest Rate
2.8%
Mortgage Type
New Conventional
Estimated Equity
$494,010
Purchase Details
Closed on
Mar 25, 2002
Sold by
Brooks Howard D and Brooks Zohreh A
Bought by
Azimi Zohreh
Home Financials for this Owner
Home Financials are based on the most recent Mortgage that was taken out on this home.
Original Mortgage
$200,000
Interest Rate
6.89%
Mortgage Type
New Conventional
Purchase Details
Closed on
Aug 2, 1996
Sold by
Protege Homes Llc
Bought by
Brooks Howard D
Create a Home Valuation Report for This Property
The Home Valuation Report is an in-depth analysis detailing your home's value as well as a comparison with similar homes in the area
Home Values in the Area
Average Home Value in this Area
Purchase History
| Date | Buyer | Sale Price | Title Company |
|---|---|---|---|
| Mugalikar Ambarish | $510,000 | -- | |
| Mugalikar Ambarish | -- | -- | |
| Azimi Zohreh | -- | -- | |
| Brooks Howard D | $266,900 | -- |
Source: Public Records
Mortgage History
| Date | Status | Borrower | Loan Amount |
|---|---|---|---|
| Open | Mugalikar Ambarish | $459,000 | |
| Closed | Mugalikar Ambarish | $459,000 | |
| Previous Owner | Azimi Zohreh | $200,000 | |
| Closed | Brooks Howard D | $0 |
Source: Public Records
Tax History Compared to Growth
Tax History
| Year | Tax Paid | Tax Assessment Tax Assessment Total Assessment is a certain percentage of the fair market value that is determined by local assessors to be the total taxable value of land and additions on the property. | Land | Improvement |
|---|---|---|---|---|
| 2025 | $6,805 | $307,000 | $86,560 | $220,440 |
| 2023 | $6,805 | $329,560 | $86,560 | $243,000 |
| 2022 | $6,531 | $257,640 | $57,800 | $199,840 |
| 2021 | $6,052 | $204,000 | $51,040 | $152,960 |
| 2020 | $4,692 | $210,120 | $56,840 | $153,280 |
| 2019 | $572 | $206,400 | $55,840 | $150,560 |
| 2018 | $5,431 | $191,240 | $68,440 | $122,800 |
| 2017 | $4,589 | $147,000 | $30,120 | $116,880 |
| 2016 | $4,515 | $147,000 | $30,120 | $116,880 |
| 2015 | $4,564 | $147,000 | $30,120 | $116,880 |
| 2014 | $5,184 | $147,000 | $30,120 | $116,880 |
Source: Public Records
Map
Nearby Homes
- 5650 Preserve Cir
- 5455 Woodrun Ln
- 5735 Sunset Maple Dr
- 680 Evening Pine Ln
- 640 Evening Pine Ln
- 5440 Vicarage Walk
- 12470 Concord Hall Dr
- 12205 Stevens Creek Dr
- 140 Ashewoode Downs Ln
- 5635 Ashewoode Downs Dr
- 5510 Vicarage Walk
- 110 W Meadows Ct
- 11835 Leeward Walk Cir
- 12595 Huntington Trace
- 7105 Brookwood Way
- 7530 Newstead Dr
- 330 Willow Oak Ct
- 320 Willow Oak Ct
- 335 Willow Oak Ct Unit 6
- 310 Willow Oak Ct Unit 620
- 310 Willow Oak Ct
- 445 Willow Oak Terrace Unit 6
- 455 Willow Oak Terrace Unit 6
- 435 Willow Oak Terrace
- 0 Willow Oak Ct Unit 8235236
- 0 Willow Oak Ct Unit 8825865
- 325 Willow Oak Ct
- 300 Willow Oak Ct
- 12342 Sunset Maple Terrace
- 315 Willow Oak Ct Unit 6
- 455 Eastbourne Way
- 455 Eastbourne Way Unit 47
- 12332 Sunset Maple Terrace
- 12322 Sunset Maple Terrace Unit 6
- 425 Willow Oak Terrace
- 450 Willow Oak Terrace