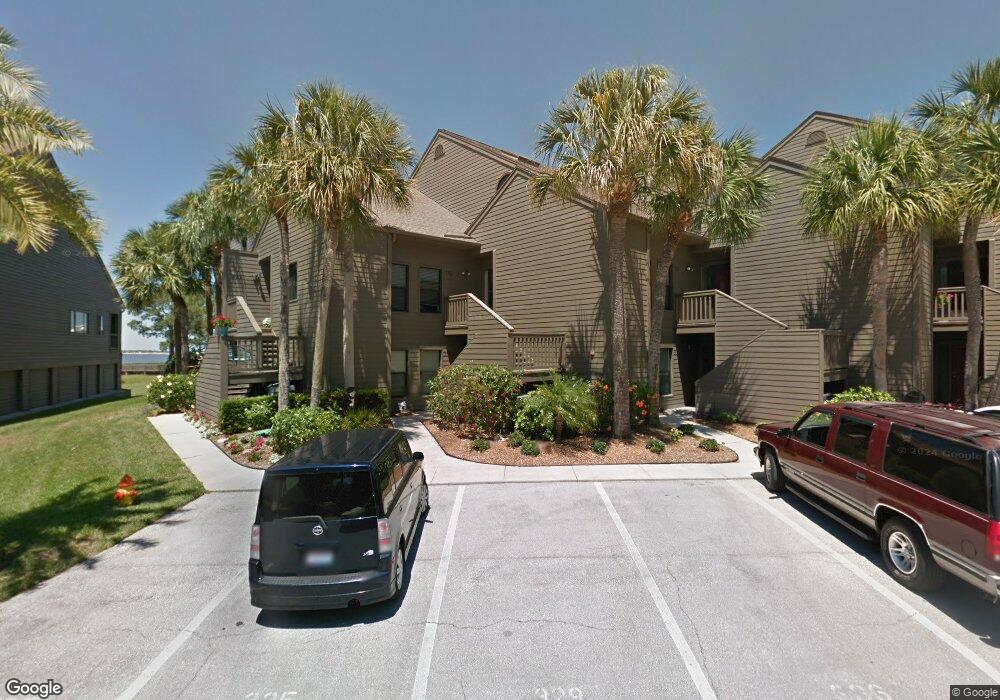
330 Windrush Loop Unit 339 Tarpon Springs, FL 34689
Estimated Value: $352,836 - $423,000
Studio
2
Baths
1,070
Sq Ft
$360/Sq Ft
Est. Value
About This Home
This home is located at 330 Windrush Loop Unit 339, Tarpon Springs, FL 34689 and is currently estimated at $385,459, approximately $360 per square foot. 330 Windrush Loop Unit 339 is a home located in Pinellas County with nearby schools including Tarpon Springs High School, Sunset Hills Elementary School, and Tarpon Springs Middle School.
Ownership History
Date
Name
Owned For
Owner Type
Purchase Details
Closed on
Jan 14, 2025
Sold by
Ryan Patricia and Joyce John J
Bought by
Ryan Patricia
Current Estimated Value
Purchase Details
Closed on
Dec 30, 2024
Sold by
Vigneau Penny
Bought by
Ryan Patricia
Purchase Details
Closed on
Jun 18, 2021
Sold by
Vincent Patricia J and Vincent Duane E
Bought by
Vigneau Penny
Purchase Details
Closed on
Sep 6, 2013
Sold by
Word Denise and Word Gary
Bought by
Word Gary
Purchase Details
Closed on
May 27, 2005
Sold by
D M N K Holding Co
Bought by
Vincent Duane E and Vincent Patricia J
Home Financials for this Owner
Home Financials are based on the most recent Mortgage that was taken out on this home.
Original Mortgage
$182,400
Interest Rate
5.66%
Mortgage Type
Fannie Mae Freddie Mac
Create a Home Valuation Report for This Property
The Home Valuation Report is an in-depth analysis detailing your home's value as well as a comparison with similar homes in the area
Home Values in the Area
Average Home Value in this Area
Purchase History
| Date | Buyer | Sale Price | Title Company |
|---|---|---|---|
| Ryan Patricia | $100 | None Listed On Document | |
| Ryan Patricia | $380,000 | None Listed On Document | |
| Ryan Patricia | $380,000 | None Listed On Document | |
| Vigneau Penny | $290,500 | Total Title Solutions Llc | |
| Word Gary | -- | Attorney | |
| Vincent Duane E | $228,000 | Title Clearinghouse |
Source: Public Records
Mortgage History
| Date | Status | Borrower | Loan Amount |
|---|---|---|---|
| Previous Owner | Vincent Duane E | $182,400 |
Source: Public Records
Tax History
| Year | Tax Paid | Tax Assessment Tax Assessment Total Assessment is a certain percentage of the fair market value that is determined by local assessors to be the total taxable value of land and additions on the property. | Land | Improvement |
|---|---|---|---|---|
| 2025 | $5,795 | $156,012 | -- | -- |
| 2024 | $5,571 | $324,232 | -- | $324,232 |
| 2023 | $5,571 | $329,949 | $0 | $329,949 |
| 2022 | $4,834 | $256,073 | $0 | $256,073 |
| 2021 | $3,208 | $175,642 | $0 | $0 |
| 2020 | $2,934 | $156,223 | $0 | $0 |
| 2019 | $2,830 | $163,114 | $0 | $163,114 |
| 2018 | $2,732 | $167,691 | $0 | $0 |
| 2017 | $2,556 | $156,366 | $0 | $0 |
| 2016 | $2,111 | $107,092 | $0 | $0 |
| 2015 | $1,937 | $93,676 | $0 | $0 |
| 2014 | $1,857 | $96,459 | $0 | $0 |
Source: Public Records
Map
Nearby Homes
- 341 Windrush Loop
- 351 Windrush Loop
- 36 Windrush Bay Dr Unit 36
- 428 Windrush Bay Dr
- 25 Windrush Bay Dr
- 617 Windrush Bay Dr Unit 617
- 322 Windrush Loop Unit 22
- 321 Windrush Loop
- 301 Windrush Loop
- 1907 Gulf Beach Blvd
- 510 Windrush Bay Dr
- 503 Windrush Bay Dr
- 1726 Sunkissed Dr
- 110 Parkside Colony Dr
- 500 Sanibel Ct
- 511 Seaview Dr
- GOLDEN GATEWAY HOMES Kenneth Way
- 1607 Gulf Rd
- 640 Kenneth Way
- 1503 Tallahassee Dr
- 346 Windrush Loop Unit 46
- 339 Windrush Loop Unit 39
- 350 Windrush Loop Unit 50
- 348 Windrush Loop
- 346 Windrush Loop
- 344 Windrush Loop Unit 44
- 343 Windrush Loop Unit 43
- 342 Windrush Loop
- 340 Windrush Loop Unit 40
- 339 Windrush Loop
- 338 Windrush Loop
- 337 Windrush Loop
- 336 Windrush Loop Unit 36
- 335 Windrush Loop Unit 35
- 334 Windrush Loop Unit 34
- 333 Windrush Loop Unit 33
- 332 Windrush Loop
- 331 Windrush Loop Unit 31
- 330 Windrush Loop Unit 30
- 329 Windrush Loop
Your Personal Tour Guide
Ask me questions while you tour the home.