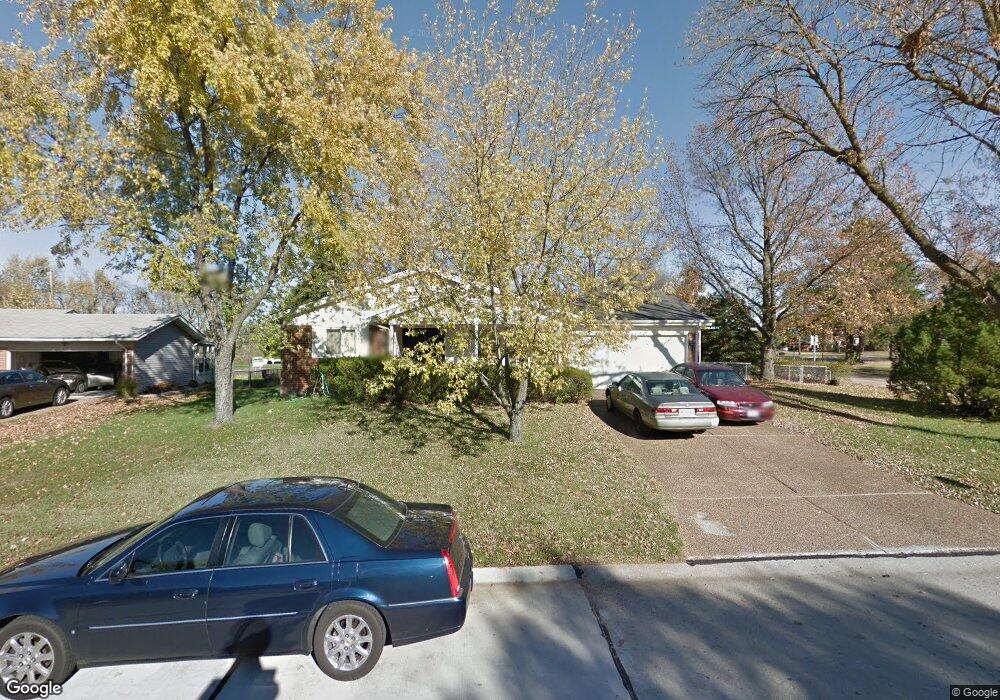
3300 Brunswick Dr Florissant, MO 63033
Estimated Value: $204,000 - $226,000
3
Beds
2
Baths
1,407
Sq Ft
$151/Sq Ft
Est. Value
About This Home
This home is located at 3300 Brunswick Dr, Florissant, MO 63033 and is currently estimated at $211,804, approximately $150 per square foot. 3300 Brunswick Dr is a home located in St. Louis County with nearby schools including Wedgwood Elementary School, Cross Keys Middle School, and McCluer North High School.
Ownership History
Date
Name
Owned For
Owner Type
Purchase Details
Closed on
Dec 4, 2018
Sold by
Bell Luther and Bell Deana
Bought by
Bell Luther
Current Estimated Value
Home Financials for this Owner
Home Financials are based on the most recent Mortgage that was taken out on this home.
Original Mortgage
$100,000
Outstanding Balance
$88,278
Interest Rate
4.9%
Mortgage Type
VA
Estimated Equity
$123,526
Purchase Details
Closed on
Jan 22, 2016
Sold by
Bell Deana
Bought by
Bell Luther
Purchase Details
Closed on
Mar 29, 2001
Sold by
Swart Roger A & Susan G Trustees
Bought by
Bell Luther and Bell Deana M
Home Financials for this Owner
Home Financials are based on the most recent Mortgage that was taken out on this home.
Original Mortgage
$108,792
Interest Rate
6.98%
Mortgage Type
FHA
Purchase Details
Closed on
Jul 6, 1999
Sold by
Swart Roger A and Swart Gail Susan
Bought by
Swart Roger A and Swart Susan G
Create a Home Valuation Report for This Property
The Home Valuation Report is an in-depth analysis detailing your home's value as well as a comparison with similar homes in the area
Home Values in the Area
Average Home Value in this Area
Purchase History
| Date | Buyer | Sale Price | Title Company |
|---|---|---|---|
| Bell Luther | -- | Fidelity Ntnl Title Group Ri | |
| Bell Luther | -- | None Available | |
| Bell Luther | $110,500 | -- | |
| Bell Luther | $110,500 | -- | |
| Swart Roger A | -- | -- |
Source: Public Records
Mortgage History
| Date | Status | Borrower | Loan Amount |
|---|---|---|---|
| Open | Bell Luther | $100,000 | |
| Closed | Bell Luther | $108,792 |
Source: Public Records
Tax History Compared to Growth
Tax History
| Year | Tax Paid | Tax Assessment Tax Assessment Total Assessment is a certain percentage of the fair market value that is determined by local assessors to be the total taxable value of land and additions on the property. | Land | Improvement |
|---|---|---|---|---|
| 2025 | $2,341 | $34,430 | $3,970 | $30,460 |
| 2024 | $2,341 | $31,030 | $3,440 | $27,590 |
| 2023 | $2,332 | $31,030 | $3,440 | $27,590 |
| 2022 | $2,415 | $28,240 | $3,440 | $24,800 |
| 2021 | $2,407 | $28,240 | $3,440 | $24,800 |
| 2020 | $1,956 | $21,300 | $3,970 | $17,330 |
| 2019 | $1,918 | $21,300 | $3,970 | $17,330 |
| 2018 | $1,707 | $16,910 | $3,120 | $13,790 |
| 2017 | $1,698 | $16,910 | $3,120 | $13,790 |
| 2016 | $1,727 | $16,760 | $2,760 | $14,000 |
| 2015 | $1,736 | $16,760 | $2,760 | $14,000 |
| 2014 | $1,797 | $17,920 | $5,040 | $12,880 |
Source: Public Records
Map
Nearby Homes
- 2525 Wedgwood Dr W
- 3370 Suncrest Dr
- 2756 Aberdeen Dr
- 2953 New Castle Dr
- 15412 Forte de France Ln
- 2980 Wellington Dr
- 15467 Jost Main St
- 6 Willow Creek Estates Ct
- 644 Shadow Rock Dr
- 2701 Wellington Dr
- 519 Greenway Chase Ct
- 3914 Birkemeier Dr
- 2036 Retford Dr
- 4120 90th Ave
- 549 Rancho Ln
- 1993 Greenheath Dr
- 2433 Lavin Ct
- 3230 Churchill Dr
- 2133 Morning Mist Ct
- 733 Mediterranean Dr
- 3310 Brunswick Dr
- 3290 Brunswick Dr
- 3330 Brunswick Dr
- 2585 Yorkshire Dr
- 3285 Brunswick Dr
- 3340 Brunswick Dr
- 3325 Brunswick Dr
- 3280 Brunswick Dr
- 2555 Yorkshire Dr
- 2560 Yorkshire Dr
- 3350 Brunswick Dr
- 3345 Brunswick Dr
- 3270 Brunswick Dr
- 2575 Cambridge Dr
- 2555 Cambridge Dr
- 2540 Yorkshire Dr
- 2525 Yorkshire Dr
- 2535 Cambridge Dr
- 14910 New Halls Ferry Rd
- 3370 Brunswick Dr