Estimated Value: $227,724 - $288,000
--
Bed
--
Bath
1,778
Sq Ft
$151/Sq Ft
Est. Value
About This Home
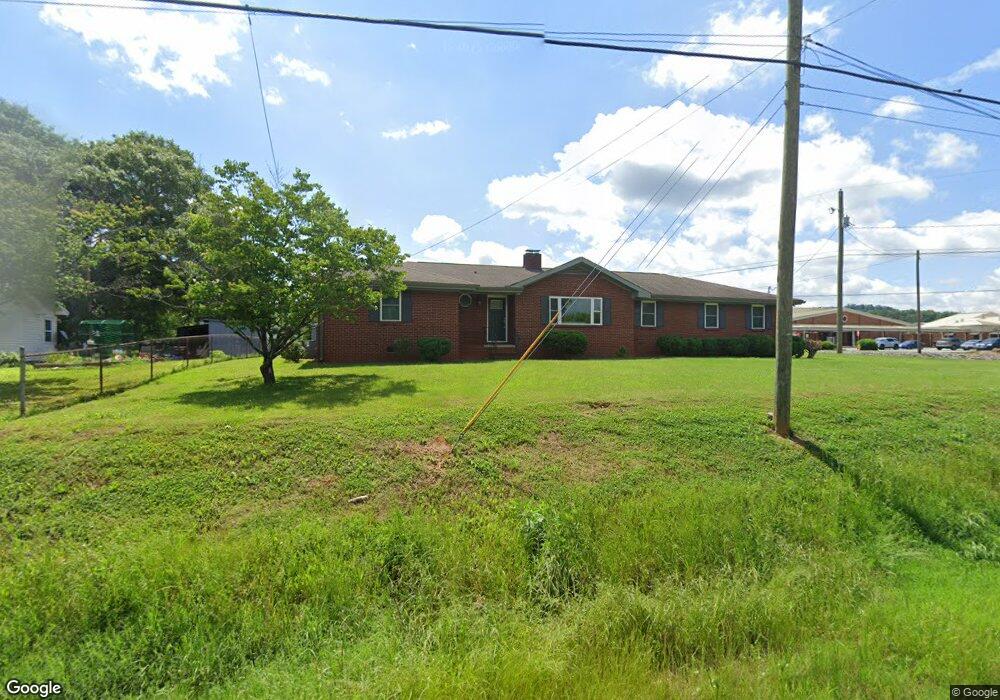
This home is located at 3300 Calhoun Rd NE, Rome, GA 30161 and is currently estimated at $267,931, approximately $150 per square foot. 3300 Calhoun Rd NE is a home located in Floyd County with nearby schools including Model Middle School, Model High School, and Unity Christian School.
Ownership History
Date
Name
Owned For
Owner Type
Purchase Details
Closed on
May 15, 2025
Sold by
Sims Glenda Denise Phillips
Bought by
Sims Family Trust Dated May 15 2025 and Brock Jordan Tr
Current Estimated Value
Purchase Details
Closed on
Jan 30, 2024
Sold by
Phillips James R
Bought by
Sims Glenda Denise Phillips
Home Financials for this Owner
Home Financials are based on the most recent Mortgage that was taken out on this home.
Original Mortgage
$70,000
Interest Rate
6.62%
Mortgage Type
New Conventional
Purchase Details
Closed on
Sep 9, 2022
Sold by
Phillips James R
Bought by
Sims Glenda Denise Phillips
Purchase Details
Closed on
Nov 10, 2014
Sold by
Phillips James R
Bought by
Floyd County Georgia
Purchase Details
Closed on
Nov 19, 2002
Sold by
Phillips James R
Bought by
Phillips James R and Philli Kathryn S
Purchase Details
Closed on
Jun 11, 1963
Sold by
Odom Frank and Walker Mae
Bought by
Phillips James R
Purchase Details
Closed on
Jan 1, 1950
Sold by
Sgt Walker S and Sgt Wilburn M
Bought by
Odom Frank and Walker Mae
Purchase Details
Closed on
Jan 1, 1947
Bought by
Sgt Walker S and Sgt Wilburn M
Create a Home Valuation Report for This Property
The Home Valuation Report is an in-depth analysis detailing your home's value as well as a comparison with similar homes in the area
Home Values in the Area
Average Home Value in this Area
Purchase History
| Date | Buyer | Sale Price | Title Company |
|---|---|---|---|
| Sims Family Trust Dated May 15 2025 | -- | -- | |
| Sims Glenda Denise Phillips | -- | -- | |
| Sims Glenda Denise Phillips | -- | -- | |
| Floyd County Georgia | $20,000 | -- | |
| Phillips James R | -- | -- | |
| Phillips James R | -- | -- | |
| Odom Frank | -- | -- | |
| Sgt Walker S | -- | -- |
Source: Public Records
Mortgage History
| Date | Status | Borrower | Loan Amount |
|---|---|---|---|
| Previous Owner | Sims Glenda Denise Phillips | $70,000 |
Source: Public Records
Tax History Compared to Growth
Tax History
| Year | Tax Paid | Tax Assessment Tax Assessment Total Assessment is a certain percentage of the fair market value that is determined by local assessors to be the total taxable value of land and additions on the property. | Land | Improvement |
|---|---|---|---|---|
| 2024 | $2,528 | $91,852 | $5,377 | $86,475 |
| 2023 | $1,933 | $88,557 | $4,550 | $84,007 |
| 2022 | $2,041 | $68,806 | $3,722 | $65,084 |
| 2021 | $542 | $50,150 | $3,309 | $46,841 |
| 2020 | $464 | $40,958 | $2,688 | $38,270 |
| 2019 | $451 | $38,695 | $2,688 | $36,007 |
| 2018 | $453 | $36,545 | $2,688 | $33,857 |
| 2017 | $448 | $34,302 | $2,688 | $31,614 |
| 2016 | $446 | $33,605 | $2,680 | $30,925 |
| 2015 | $429 | $33,605 | $2,680 | $30,925 |
| 2014 | $429 | $34,165 | $3,240 | $30,925 |
Source: Public Records
Map
Nearby Homes
- 3349 Calhoun Rd NE
- 18 Marlynn Dr NE
- 21 Fernwood Way NE
- 29 Woodcliffe Dr NE
- 489 Barron Rd NE
- 24 Woodcliffe Dr NE
- 3 NE Page Dr
- 107 Whispering Pines NE
- 105 Whispering Pines NE
- 445 2nd Shannon St
- 35 Old Shannon Rd NE
- 195 Shannon Rd NE
- 84 Harris Rd NE
- 6 Keystone Ln NE
- 1055 E Hermitage Rd NE
- 13 Granite Way NE
- 12 Round Rock Cir NE
- 58 Round Rock Cir NE
- 0 Sunny Heights Dr NE Unit 20763412
- 3314 Calhoun Rd NE
- 3314 Calhoun Rd NE Unit 14
- 3314 Calhoun Rd NE
- 3305 Calhoun Rd NE
- 3297 Calhoun Rd NE
- 3323 Calhoun Rd NE
- 3328 Calhoun Rd NE
- 47 Barron Rd NE
- 3311 Calhoun Rd NE
- 10 Bert Rd NE
- 53 Barron Rd NE
- 3337 Calhoun Rd NE
- 21 Dempsey Rd NE
- 21 Dempsey Rd NE Unit 23
- 31 Dempsey Rd NE
- 31 Dempsey Rd NE Unit 33
- 3344 Calhoun Rd NE
- 3277 Calhoun Rd NE
- 63 Barron Rd NE
- 25 Dempsey Rd NE