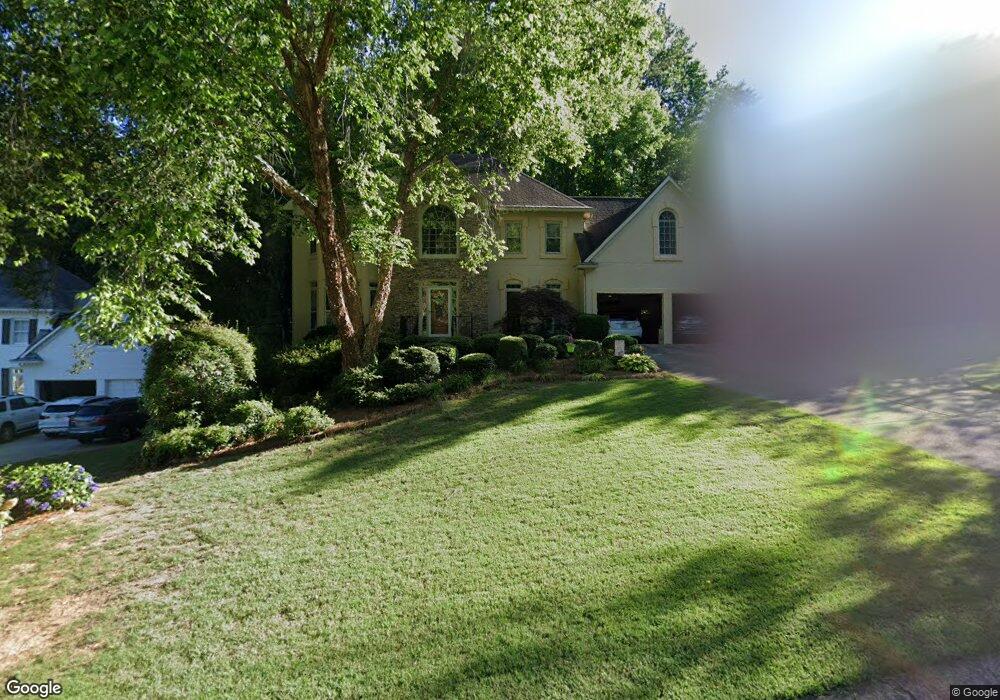
3300 Lantern Coach Ln NE Unit 2 Roswell, GA 30075
East Cobb NeighborhoodEstimated Value: $757,273 - $873,000
4
Beds
4
Baths
3,031
Sq Ft
$270/Sq Ft
Est. Value
About This Home
This home is located at 3300 Lantern Coach Ln NE Unit 2, Roswell, GA 30075 and is currently estimated at $818,818, approximately $270 per square foot. 3300 Lantern Coach Ln NE Unit 2 is a home located in Cobb County with nearby schools including Tritt Elementary School, Hightower Trail Middle School, and Pope High School.
Ownership History
Date
Name
Owned For
Owner Type
Purchase Details
Closed on
Jul 22, 2005
Sold by
Relocation Advantage Llc
Bought by
Friend Karen L and Friend Bruce
Current Estimated Value
Home Financials for this Owner
Home Financials are based on the most recent Mortgage that was taken out on this home.
Original Mortgage
$280,000
Outstanding Balance
$145,502
Interest Rate
5.59%
Mortgage Type
New Conventional
Estimated Equity
$673,316
Purchase Details
Closed on
Jun 5, 2000
Sold by
Mullis Ronald M and Mullis Lorraine R
Bought by
Mcnabb George T and Mcnabb Patricia F
Home Financials for this Owner
Home Financials are based on the most recent Mortgage that was taken out on this home.
Original Mortgage
$225,000
Interest Rate
8.11%
Mortgage Type
New Conventional
Purchase Details
Closed on
Jan 29, 1996
Sold by
Hamilton Maria G
Bought by
Mullis Ronald M Lorraine
Purchase Details
Closed on
Mar 25, 1993
Sold by
Wieland John Homes Inc
Bought by
Hamilton James H Maria G
Home Financials for this Owner
Home Financials are based on the most recent Mortgage that was taken out on this home.
Original Mortgage
$235,150
Interest Rate
7.7%
Create a Home Valuation Report for This Property
The Home Valuation Report is an in-depth analysis detailing your home's value as well as a comparison with similar homes in the area
Home Values in the Area
Average Home Value in this Area
Purchase History
| Date | Buyer | Sale Price | Title Company |
|---|---|---|---|
| Friend Karen L | $413,000 | -- | |
| Relocation Advantage Llc | $413,000 | -- | |
| Mcnabb George T | $325,500 | -- | |
| Mullis Ronald M Lorraine | $282,500 | -- | |
| Hamilton James H Maria G | $262,700 | -- |
Source: Public Records
Mortgage History
| Date | Status | Borrower | Loan Amount |
|---|---|---|---|
| Open | Relocation Advantage Llc | $280,000 | |
| Previous Owner | Mcnabb George T | $225,000 | |
| Previous Owner | Hamilton James H Maria G | $235,150 | |
| Closed | Mullis Ronald M Lorraine | $0 |
Source: Public Records
Tax History Compared to Growth
Tax History
| Year | Tax Paid | Tax Assessment Tax Assessment Total Assessment is a certain percentage of the fair market value that is determined by local assessors to be the total taxable value of land and additions on the property. | Land | Improvement |
|---|---|---|---|---|
| 2025 | $7,051 | $283,364 | $60,000 | $223,364 |
| 2024 | $7,057 | $283,364 | $60,000 | $223,364 |
| 2023 | $5,636 | $242,896 | $52,000 | $190,896 |
| 2022 | $5,723 | $219,956 | $46,000 | $173,956 |
| 2021 | $5,157 | $194,100 | $46,000 | $148,100 |
| 2020 | $5,157 | $194,100 | $46,000 | $148,100 |
| 2019 | $5,015 | $187,608 | $38,000 | $149,608 |
| 2018 | $5,015 | $187,608 | $38,000 | $149,608 |
| 2017 | $4,492 | $173,004 | $36,000 | $137,004 |
| 2016 | $4,497 | $173,004 | $36,000 | $137,004 |
| 2015 | $4,599 | $173,004 | $36,000 | $137,004 |
| 2014 | $4,354 | $160,484 | $0 | $0 |
Source: Public Records
Map
Nearby Homes
- 3333 Trails End Rd NE
- 1533 Tennessee Walker Dr NE
- 2095 Shallowford Park Manor
- 4645 Shallowford Rd
- 4680 Cambridge Approach Cir NE
- 3616 Hampstead Ln NE
- 4618 Shallowford Rd
- 3453 Drayton Dr NE
- 230 Tynebrae Place Unit 1
- 1483 Jones Rd
- 2990 Mountain Trace NE
- 3025 Creek Ct NE
- 10520 Shallowford Rd
- 10555 Shallowford Rd
- 4574 Woodland Cir NE
- 295 Lakemont Dr
- 10565 Shallowford Rd
- 3298 Lantern Coach Ln NE
- 3296 Lantern Coach Ln NE
- 3304 Lantern Coach Ln NE Unit 2
- 3309 Lantern Coach Ln NE
- 3311 Lantern Coach Ln NE
- 3307 Lantern Coach Ln NE
- 3306 Lantern Coach Ln NE
- 3305 Lantern Coach Ln NE
- 3303 Lantern Coach Ln NE Unit 22
- 3303 Lantern Coach Ln NE
- 3294 Lantern Coach Ln NE
- 3336 Trails End Rd NE
- 3340 Trails End Rd NE
- 3338 Trails End Rd NE
- 3346 Trails End Rd NE
- 3334 Trails End Rd NE
- 4945 Fairhaven Way NE
- 4943 Fairhaven Way NE
- 4947 Fairhaven Way NE
- 3292 Lantern Coach Ln NE Unit 2