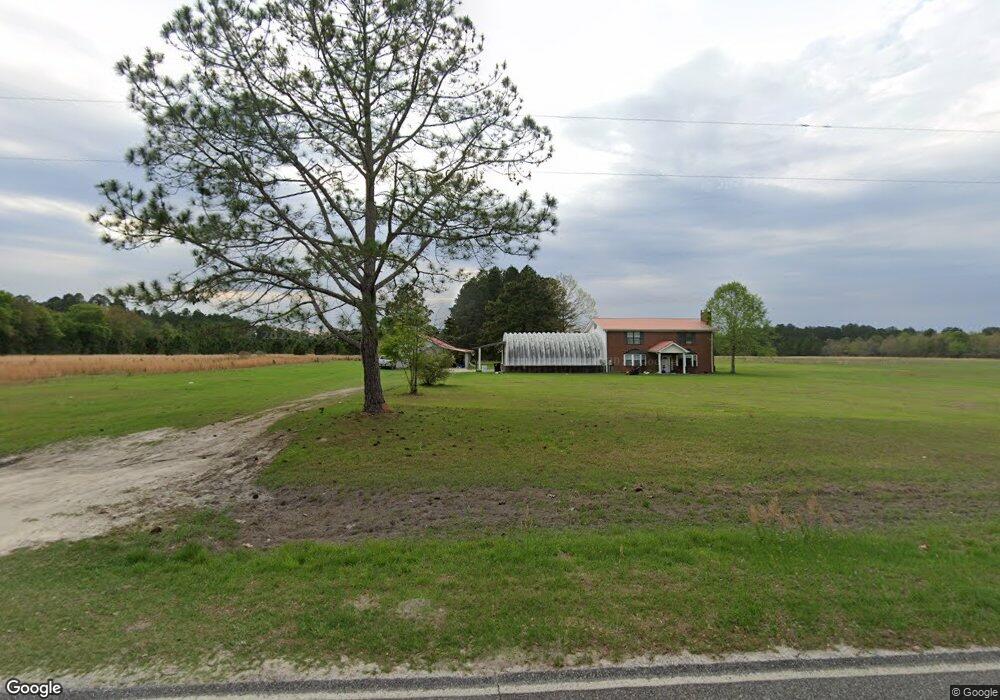
3300 Lazy Nine Rd Pearson, GA 31642
Estimated Value: $276,000 - $339,633
3
Beds
3
Baths
2,688
Sq Ft
$114/Sq Ft
Est. Value
About This Home
This home is located at 3300 Lazy Nine Rd, Pearson, GA 31642 and is currently estimated at $305,544, approximately $113 per square foot. 3300 Lazy Nine Rd is a home with nearby schools including Willacoochee Elementary School, Pearson Elementary School, and Atkinson County High School.
Ownership History
Date
Name
Owned For
Owner Type
Purchase Details
Closed on
Aug 27, 2020
Sold by
Knapik Danial Joseph
Bought by
Henris Thomas C and Henris Terri K
Current Estimated Value
Home Financials for this Owner
Home Financials are based on the most recent Mortgage that was taken out on this home.
Original Mortgage
$185,000
Outstanding Balance
$161,164
Interest Rate
2.9%
Mortgage Type
VA
Estimated Equity
$144,380
Purchase Details
Closed on
Aug 17, 2020
Sold by
Stevens Elizabeth Gayland
Bought by
Knapik Danial Joseph
Home Financials for this Owner
Home Financials are based on the most recent Mortgage that was taken out on this home.
Original Mortgage
$185,000
Outstanding Balance
$161,164
Interest Rate
2.9%
Mortgage Type
VA
Estimated Equity
$144,380
Purchase Details
Closed on
Oct 12, 2007
Sold by
Egolf John
Bought by
Egolf George Lawerence and Egolf Barry John
Purchase Details
Closed on
Dec 24, 1979
Bought by
Egolf John and Egolf Margaret G
Create a Home Valuation Report for This Property
The Home Valuation Report is an in-depth analysis detailing your home's value as well as a comparison with similar homes in the area
Purchase History
| Date | Buyer | Sale Price | Title Company |
|---|---|---|---|
| Henris Thomas C | -- | -- | |
| Knapik Danial Joseph | -- | -- | |
| Knapik Danial Joseph | -- | -- | |
| Egolf John Glen | -- | -- | |
| Knapik Danial Joseph | -- | -- | |
| Knapik Danial Joseph | $185,000 | -- | |
| Egolf George Lawerence | -- | -- | |
| Egolf John | -- | -- |
Source: Public Records
Mortgage History
| Date | Status | Borrower | Loan Amount |
|---|---|---|---|
| Open | Henris Thomas C | $185,000 | |
| Closed | Knapik Danial Joseph | $185,000 |
Source: Public Records
Tax History
| Year | Tax Paid | Tax Assessment Tax Assessment Total Assessment is a certain percentage of the fair market value that is determined by local assessors to be the total taxable value of land and additions on the property. | Land | Improvement |
|---|---|---|---|---|
| 2025 | $2,040 | $113,950 | $21,470 | $92,480 |
| 2024 | $2,007 | $81,747 | $18,586 | $63,161 |
| 2023 | $1,453 | $81,747 | $18,586 | $63,161 |
| 2022 | $1,991 | $81,747 | $18,586 | $63,161 |
| 2021 | $2,096 | $81,747 | $18,586 | $63,161 |
| 2020 | $2,238 | $81,770 | $18,609 | $63,161 |
| 2019 | $2,235 | $81,770 | $18,609 | $63,161 |
| 2018 | $2,643 | $81,770 | $18,609 | $63,161 |
| 2017 | $2,228 | $81,770 | $18,609 | $63,161 |
| 2016 | $2,224 | $81,770 | $18,609 | $63,161 |
| 2015 | -- | $81,769 | $0 | $0 |
| 2014 | -- | $76,752 | $0 | $0 |
Source: Public Records
Map
Nearby Homes
- Tbd Lazy Nine Rd
- 754 U S 221
- 139 Moore St N
- 0 Honeysuckle Ln Unit 10623320
- 536 Main St S
- 93 Beth Ln
- 74 Pearson St
- 1820 Cogdell Hwy
- Highway 64
- Highway 64
- 57 Carrington Hill Subdivision Ln
- 176 Pebble Ln
- 00 Mills Ln Tract B
- 00 Mills Ln Tract A
- 2000 Coochee Creek Rd
- 65 Mathis Rd
- 1100 U S 221
- 1114 U S 221
- 2450 Paradise Ln
- 8708 Cogdell Hwy
Your Personal Tour Guide
Ask me questions while you tour the home.