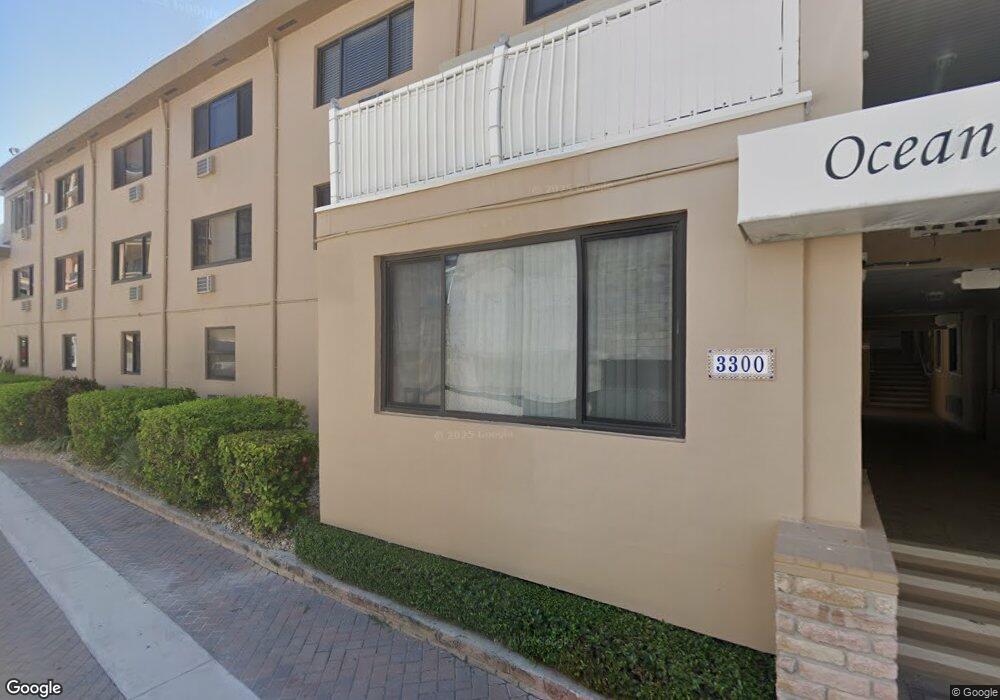
3300 N Surf Rd Unit 2AB Hollywood, FL 33019
Central Beach NeighborhoodEstimated Value: $255,000 - $331,000
1
Bed
1
Bath
286
Sq Ft
$987/Sq Ft
Est. Value
About This Home
This home is located at 3300 N Surf Rd Unit 2AB, Hollywood, FL 33019 and is currently estimated at $282,221, approximately $986 per square foot. 3300 N Surf Rd Unit 2AB is a home located in Broward County with nearby schools including Dania Elementary School, Olsen Middle School, and South Broward High School.
Ownership History
Date
Name
Owned For
Owner Type
Purchase Details
Closed on
May 31, 2023
Sold by
Minster Llc
Bought by
Montesarchio Ronald and Montesarchio Cathileen
Current Estimated Value
Purchase Details
Closed on
Dec 30, 2016
Sold by
Morris John Steven and Bolden Patricia A
Bought by
Minster Llc
Purchase Details
Closed on
Dec 1, 2016
Bought by
Minster Llc
Purchase Details
Closed on
Jul 2, 2012
Sold by
Scully Malvern D and Ross Kathryn
Bought by
Morris John S and Bolden Patricia
Purchase Details
Closed on
Sep 10, 2007
Sold by
Mainely Properties Inc
Bought by
Scully Malvern D and Ross Kathryn
Home Financials for this Owner
Home Financials are based on the most recent Mortgage that was taken out on this home.
Original Mortgage
$168,000
Interest Rate
6.62%
Mortgage Type
Purchase Money Mortgage
Purchase Details
Closed on
Jan 17, 2007
Sold by
Milewski Raymond A
Bought by
Mainely Properties Inc
Purchase Details
Closed on
Aug 1, 1989
Create a Home Valuation Report for This Property
The Home Valuation Report is an in-depth analysis detailing your home's value as well as a comparison with similar homes in the area
Home Values in the Area
Average Home Value in this Area
Purchase History
| Date | Buyer | Sale Price | Title Company |
|---|---|---|---|
| Montesarchio Ronald | $274,000 | Heritage Title | |
| Minster Llc | -- | Attorney | |
| Minster Llc | $100 | -- | |
| Morris John S | $112,000 | Attorney | |
| Scully Malvern D | $210,000 | Attorney | |
| Mainely Properties Inc | $200,000 | Attorney | |
| -- | $7,857 | -- |
Source: Public Records
Mortgage History
| Date | Status | Borrower | Loan Amount |
|---|---|---|---|
| Previous Owner | Scully Malvern D | $168,000 |
Source: Public Records
Tax History Compared to Growth
Tax History
| Year | Tax Paid | Tax Assessment Tax Assessment Total Assessment is a certain percentage of the fair market value that is determined by local assessors to be the total taxable value of land and additions on the property. | Land | Improvement |
|---|---|---|---|---|
| 2025 | $5,422 | $234,070 | $23,410 | $210,660 |
| 2024 | $4,849 | $241,610 | $24,160 | $217,450 |
| 2023 | $4,849 | $210,390 | $0 | $0 |
| 2022 | $4,297 | $191,270 | $19,130 | $172,140 |
| 2021 | $4,100 | $180,840 | $18,080 | $162,760 |
| 2020 | $4,451 | $197,590 | $19,760 | $177,830 |
| 2019 | $4,442 | $196,410 | $19,640 | $176,770 |
| 2018 | $4,075 | $194,580 | $19,460 | $175,120 |
| 2017 | $3,575 | $159,720 | $0 | $0 |
| 2016 | $3,044 | $125,190 | $0 | $0 |
| 2015 | $2,939 | $113,810 | $0 | $0 |
| 2014 | $2,677 | $103,470 | $0 | $0 |
| 2013 | -- | $94,070 | $9,410 | $84,660 |
Source: Public Records
Map
Nearby Homes
- 3415 N Ocean Dr Unit 201
- 3319 N Ocean Dr Unit 603
- 3319 N Ocean Dr Unit 507
- 3319 N Ocean Dr Unit Villa 6
- 3319 N Ocean Dr Unit Villa 8
- 0 N Surf Rd Unit A11723182
- 3300 N Surf Rd Unit 3A
- 3300 N Surf Rd Unit 17A
- 3215 N Ocean Dr Unit 302
- 3501 N Ocean Dr Unit PH7
- 3501 N Ocean Dr Unit V5
- 3501 N Ocean Dr Unit 6G
- 3501 N Ocean Dr Unit 4G
- 3300 N Ocean Dr Unit 2C
- 314 New Hampshire St Unit 23
- 311 Liberty St Unit 18
- 3200 N Ocean Dr Unit 105
- 3111 N Ocean Dr Unit 302
- 3111 N Ocean Dr Unit 1011
- 3111 N Ocean Dr Unit 1503
- 3300 N Surf Rd Unit 23A
- 3300 N Surf Rd Unit 28A
- 3300 N Surf Rd Unit 11A
- 3300 N Surf Rd Unit 5A
- 3300 N Surf Rd Unit 21A
- 3300 N Surf Rd Unit 2A
- 3300 N Surf Rd Unit 30A
- 3300 N Surf Rd Unit 18A
- 3300 N Surf Rd Unit 12A
- 3300 N Surf Rd Unit 10A
- 3300 N Surf Rd Unit 19A
- 3300 N Surf Rd Unit 27A
- 3300 N Surf Rd Unit 25A
- 3300 N Surf Rd Unit 6AB
- 3300 N Surf Rd Unit 31A
- 3300 N Surf Rd Unit 26A
- 3300 N Surf Rd Unit 24A
- 3300 N Surf Rd Unit 5AB
- 3300 N Surf Rd Unit 4AB